July 2021 Marin County Real Estate Market Report

These analyses were made in good faith with data from sources deemed reliable.

compass
Marin County Real Estate July 2021 Report cover with a photograph of rolling golden hills.
Bar chart of Marin County median house price changes from 2000 to 2021 YTD, with annotations on the financial crash and pandemic.
Chart of Marin County median house prices by quarter, rising to $1.75 million in Q2 2021.
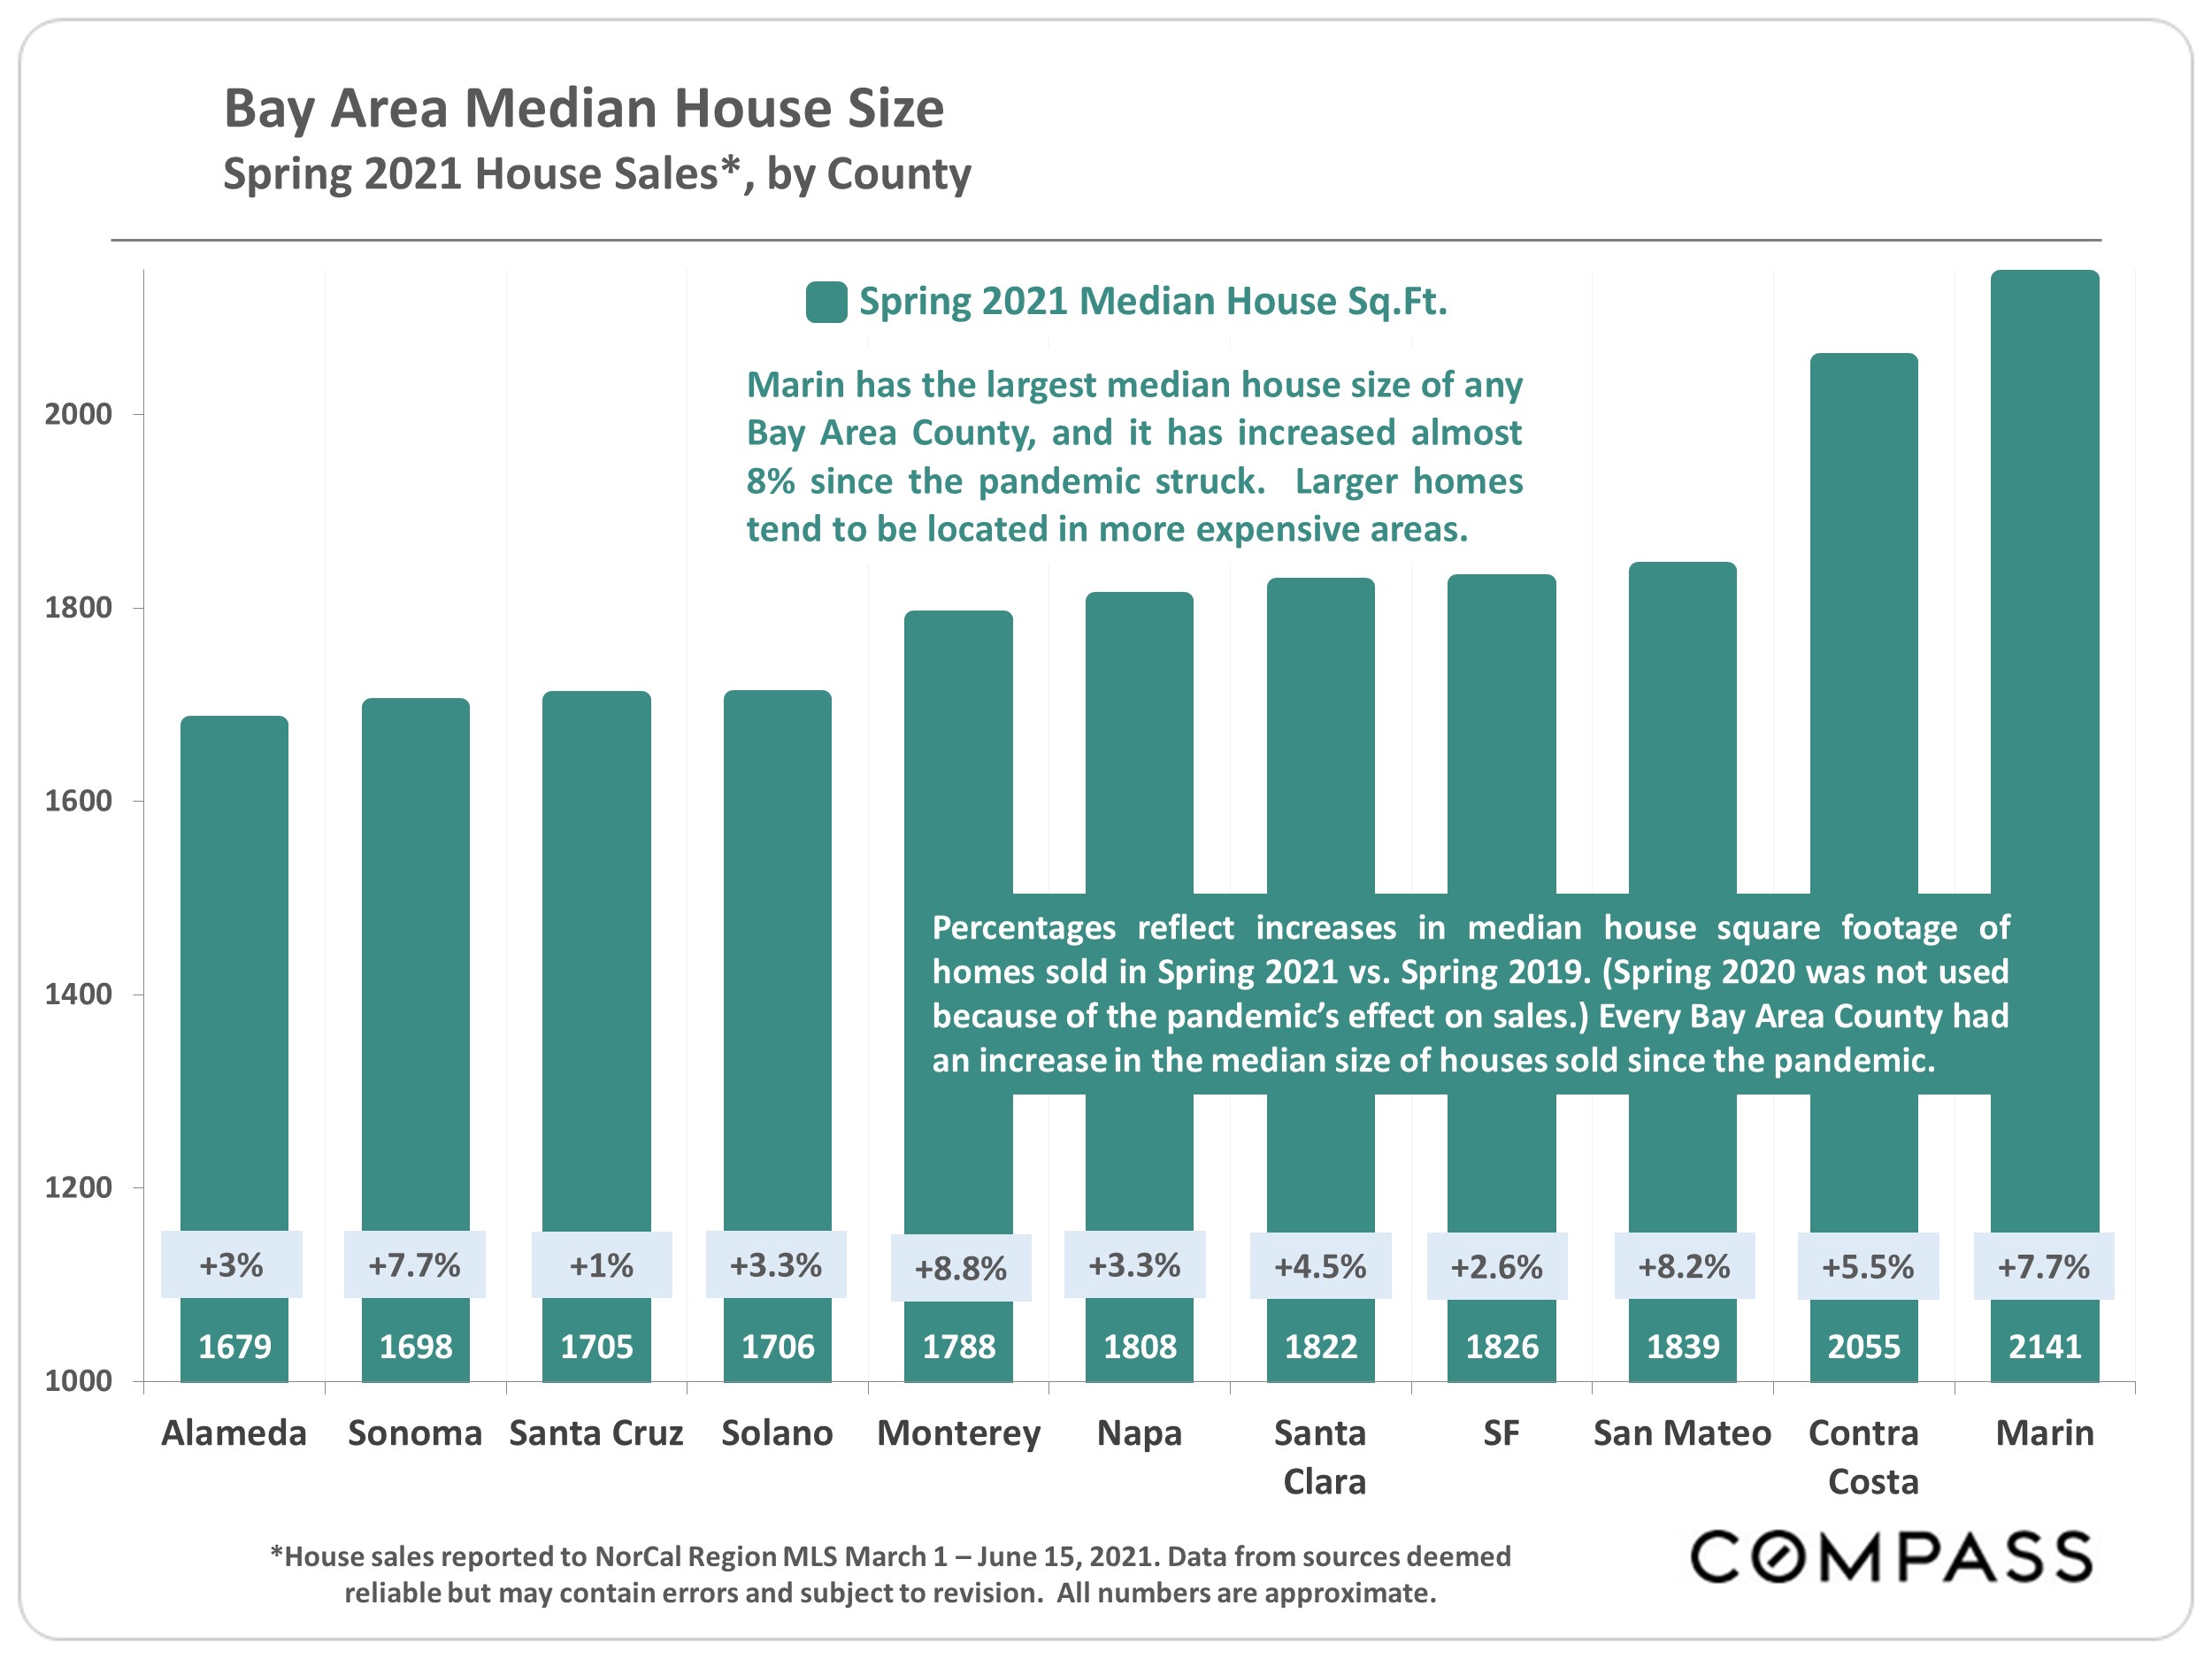
Bar chart of Spring 2021 median house size by Bay Area county; Marin leads at 2,141 square feet.
Bar chart of Marin County average house values per square foot by quarter, rising to $950 in Q2 2021.
Bar chart of Marin County condo prices, rising from $523,500 in Q1 2016 to $750,000 in Q2 2021.
Marin County home sales by price segment, June 2021, shown in a pie chart with market statistics.
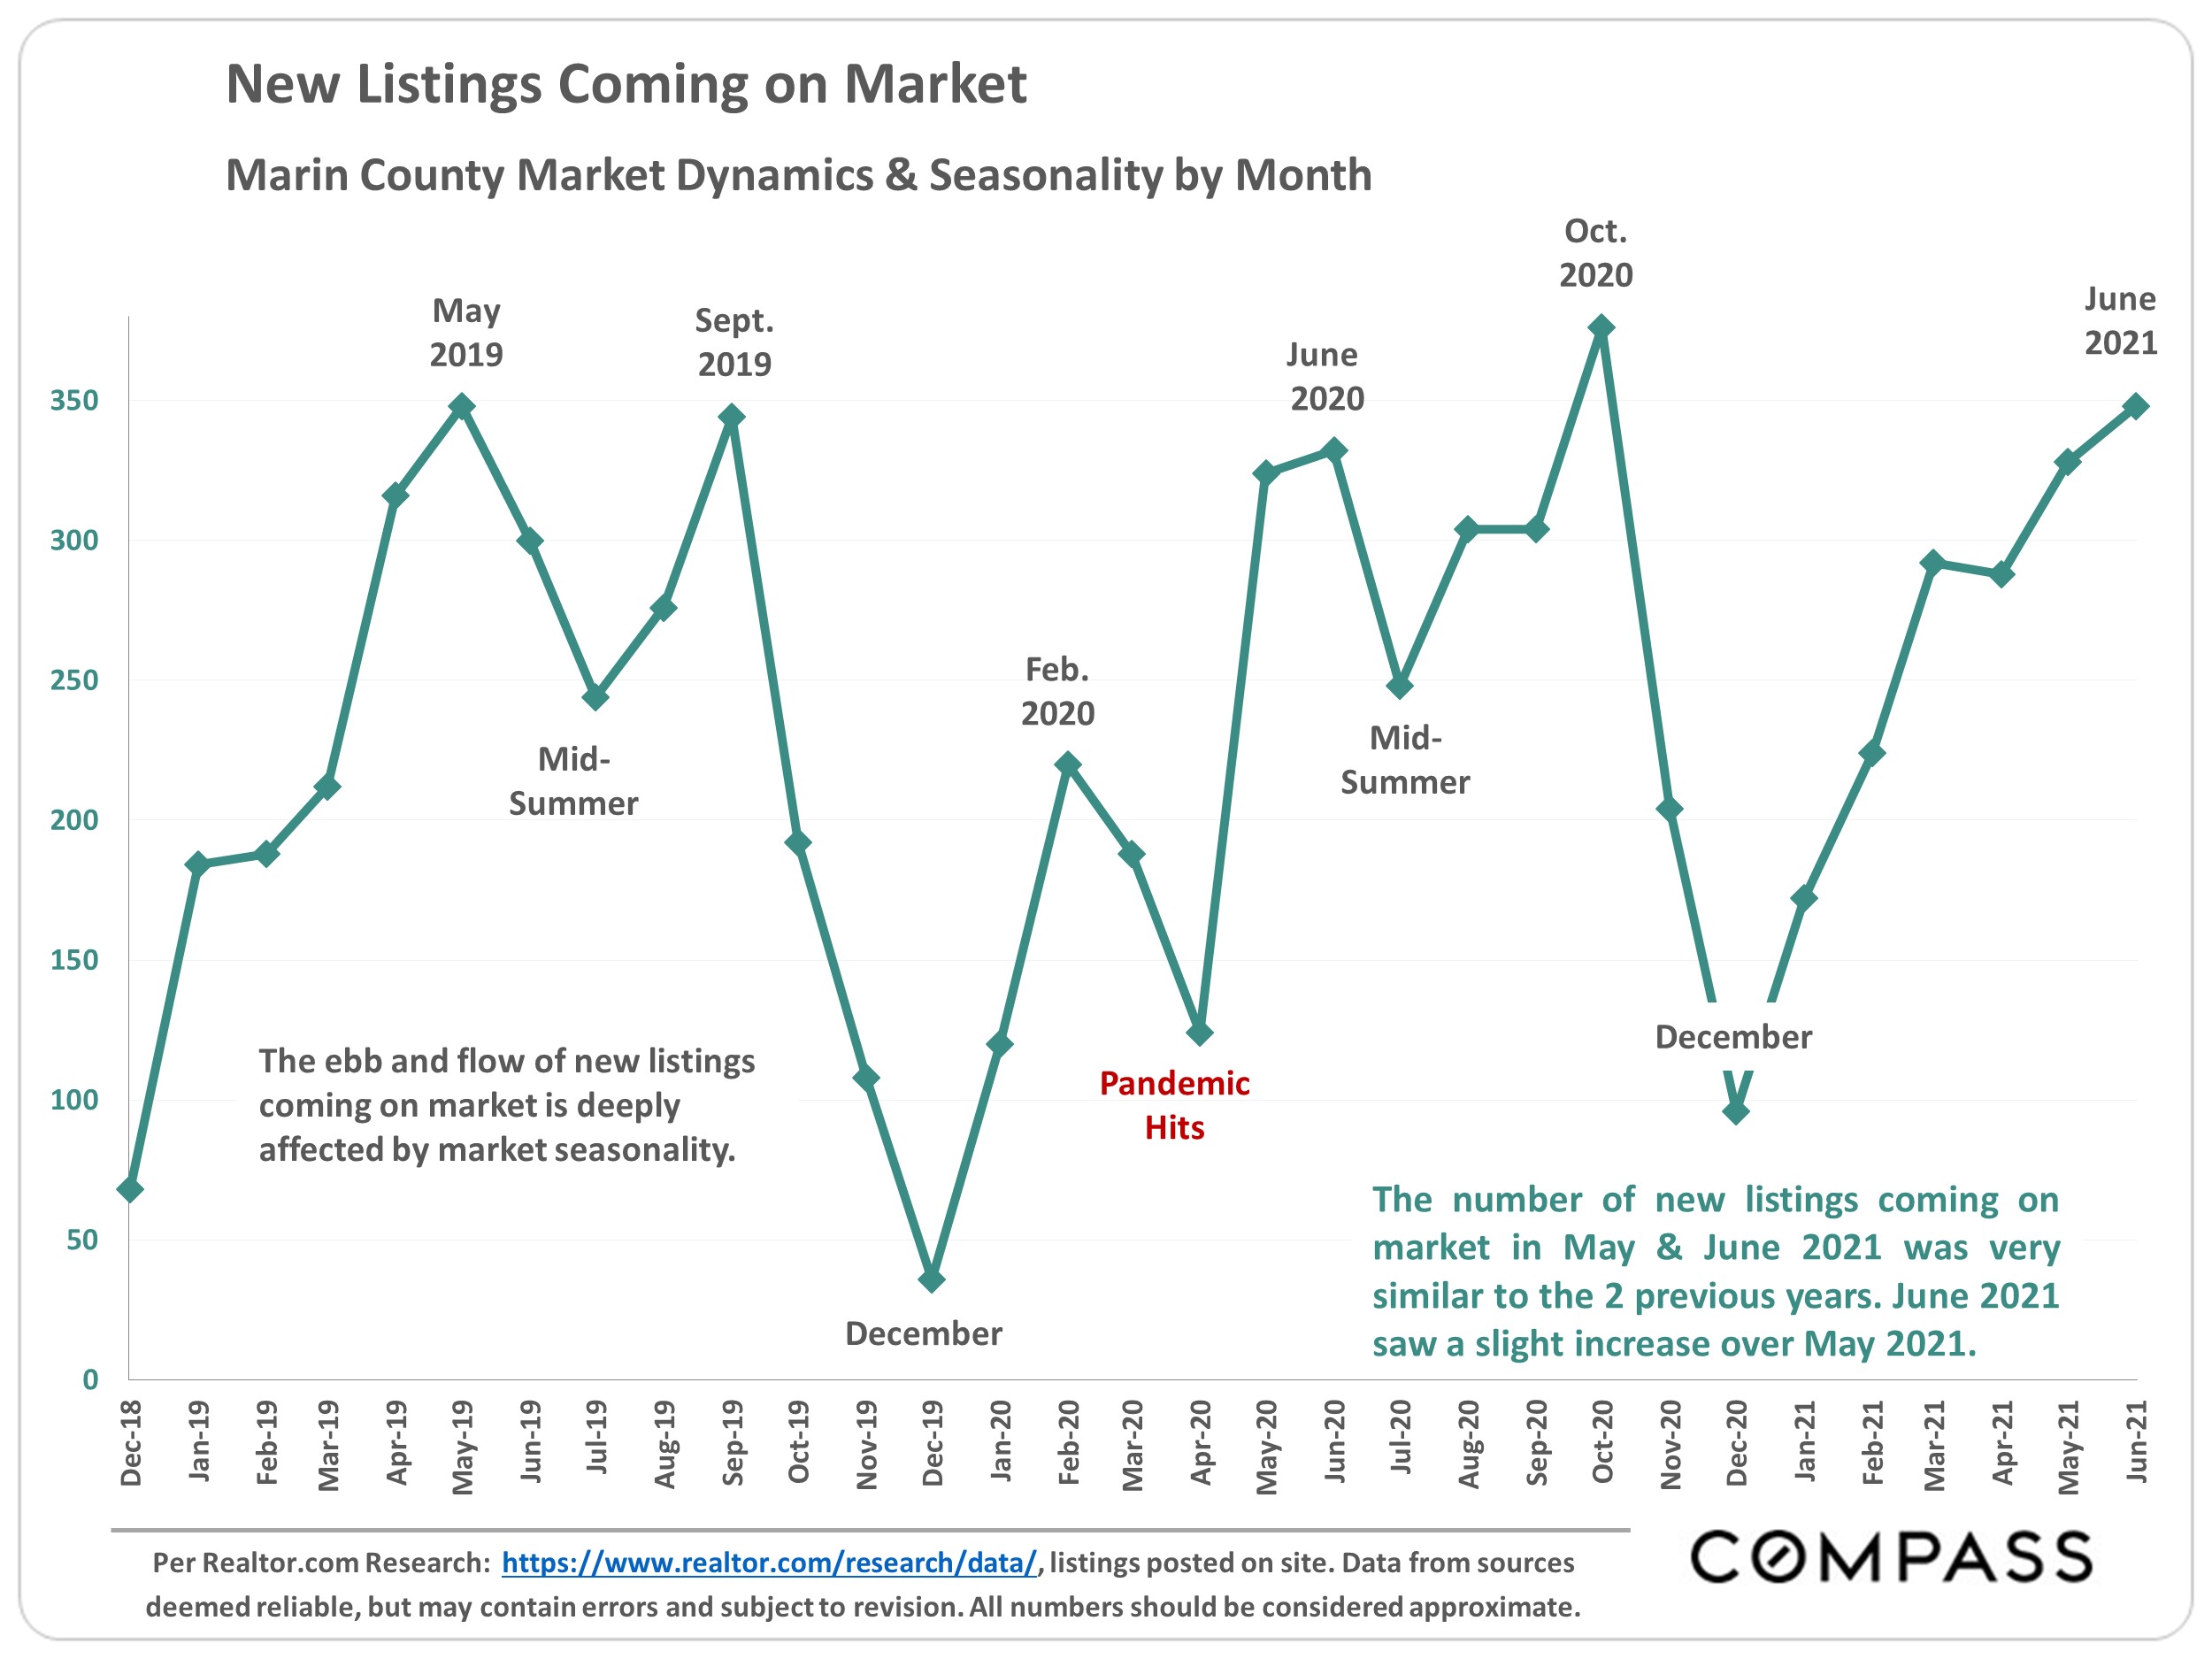
Line chart of Marin County new listings, December 2018–June 2021, showing seasonal fluctuations and a June 2021 rise.
Bar chart of Marin County active listings, January 2018–June 2021, peaking near 600 in June 2019.
Chart of Marin County listings accepting offers monthly, with seasonal peaks, a pandemic-era drop, and recovery through June 2021.
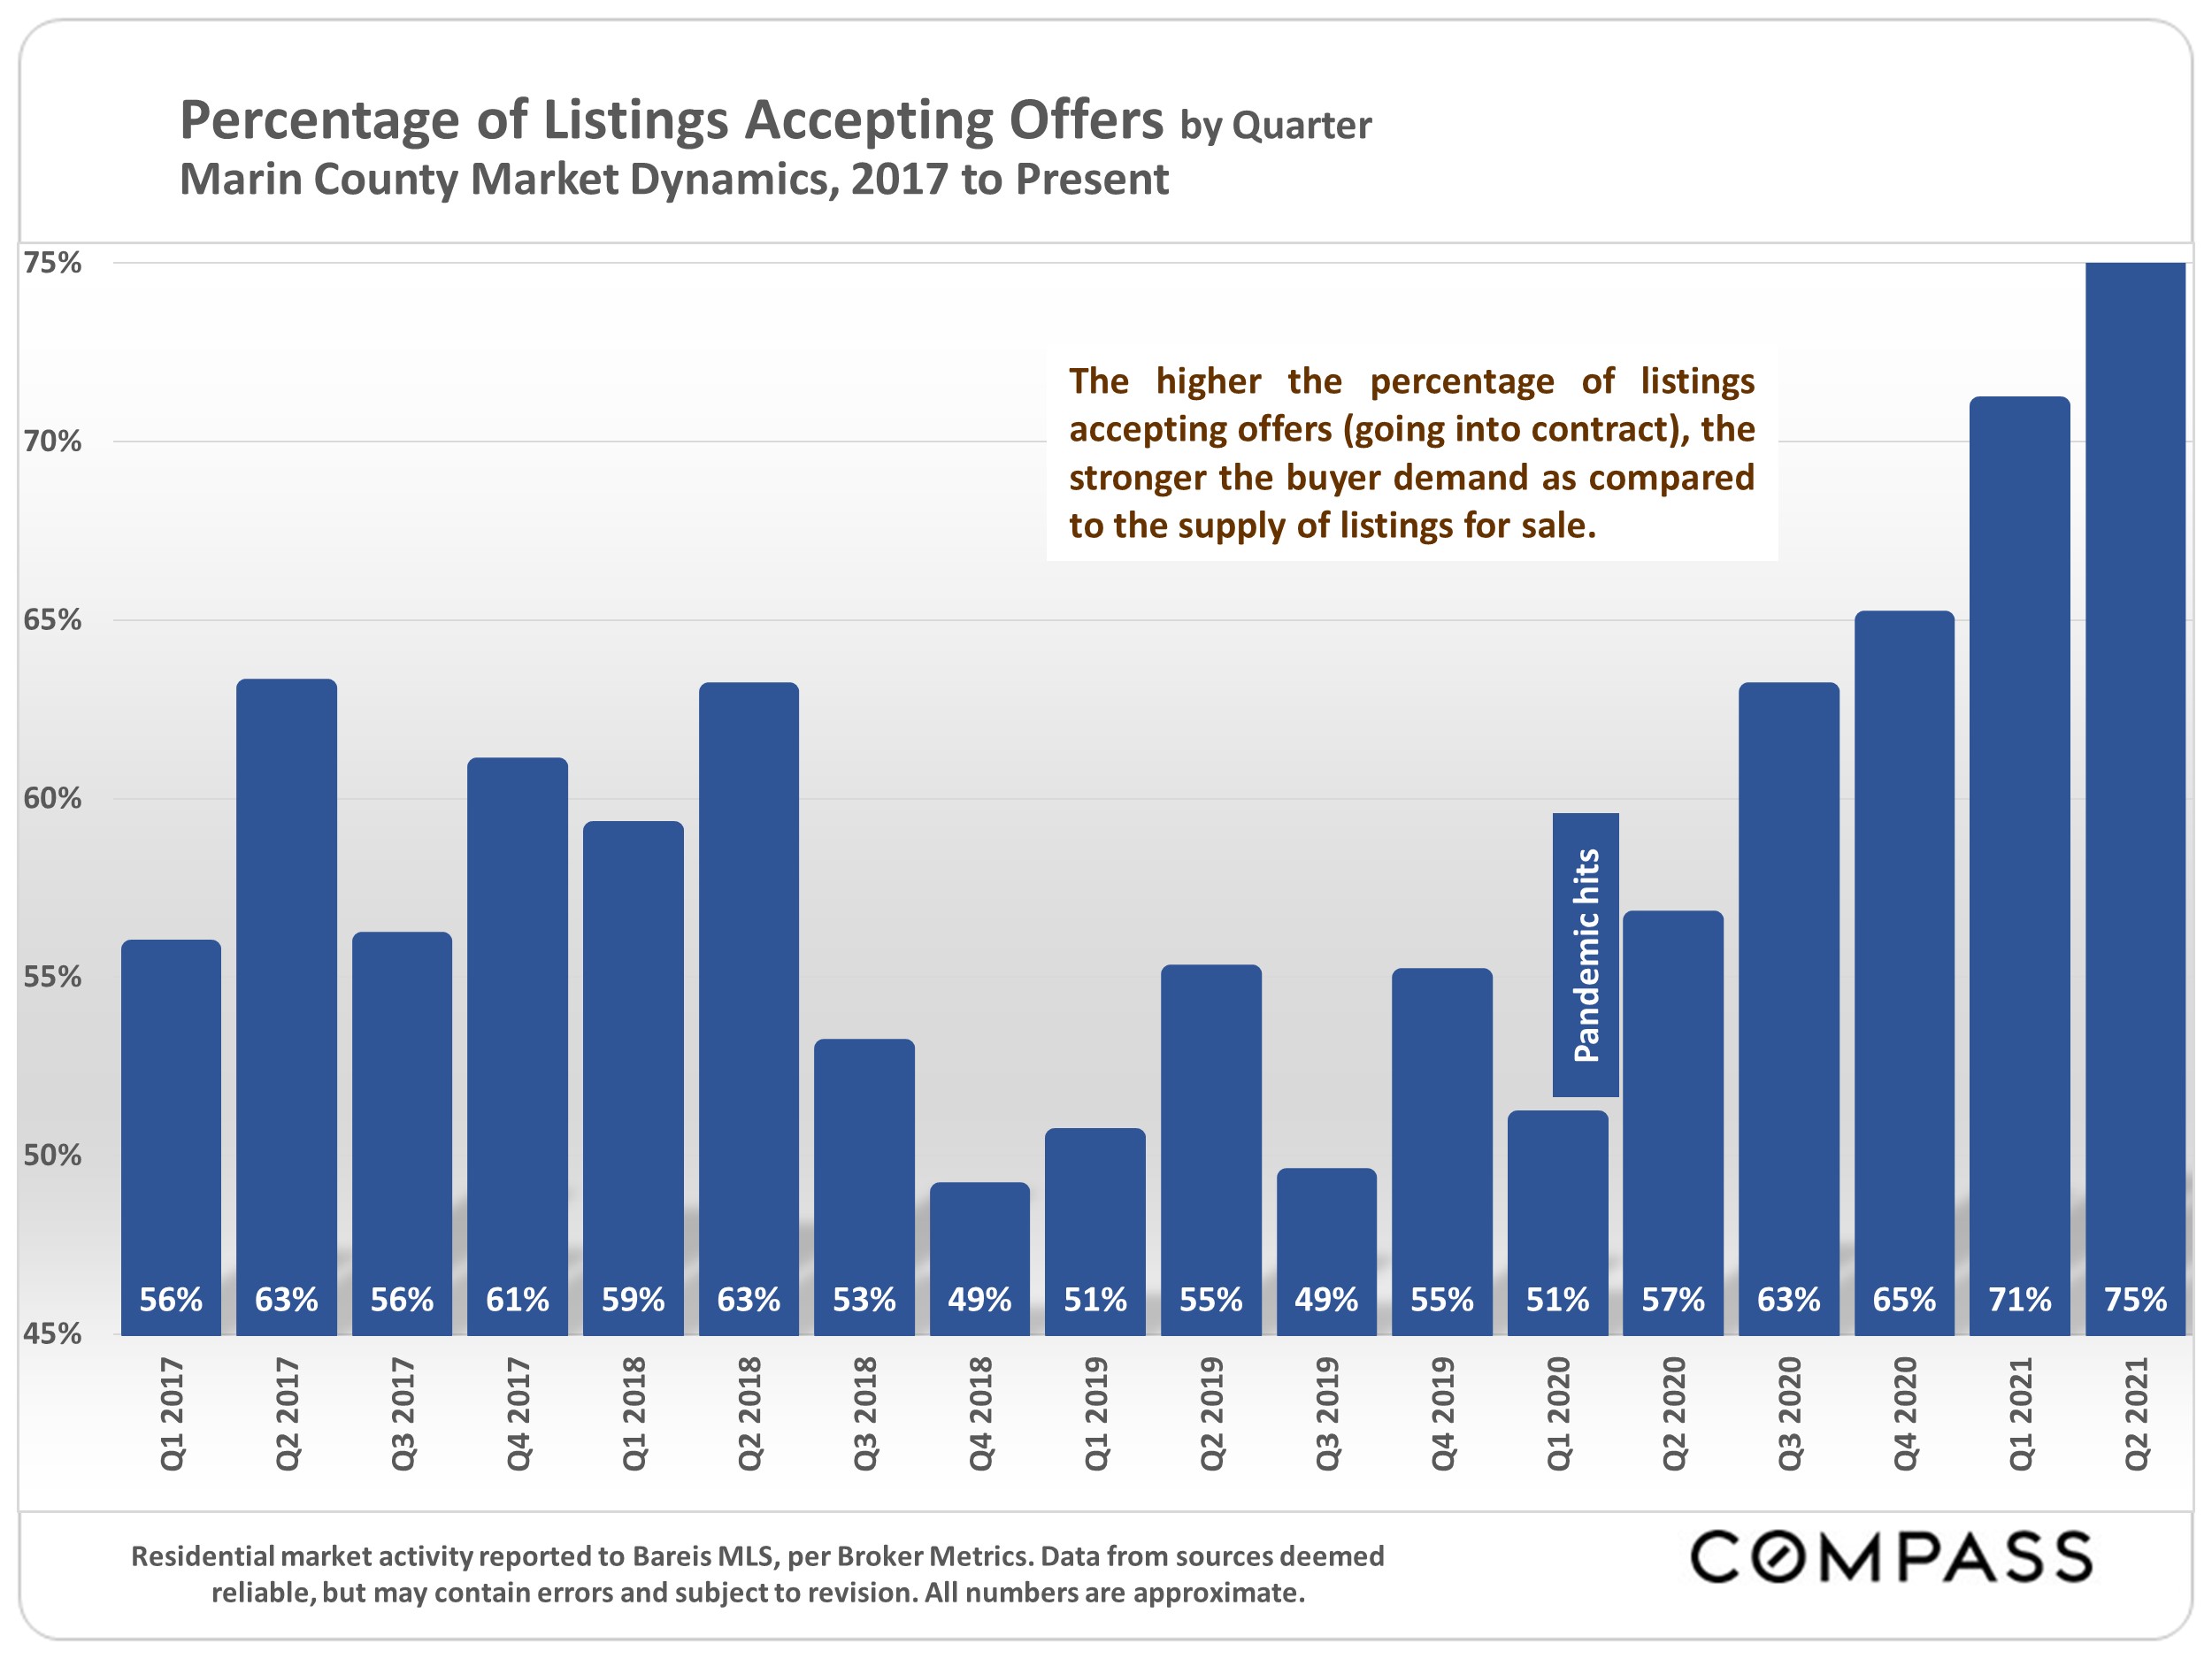
Bar chart of Marin County listings accepting offers by quarter, rising to 75% in Q2 2021.
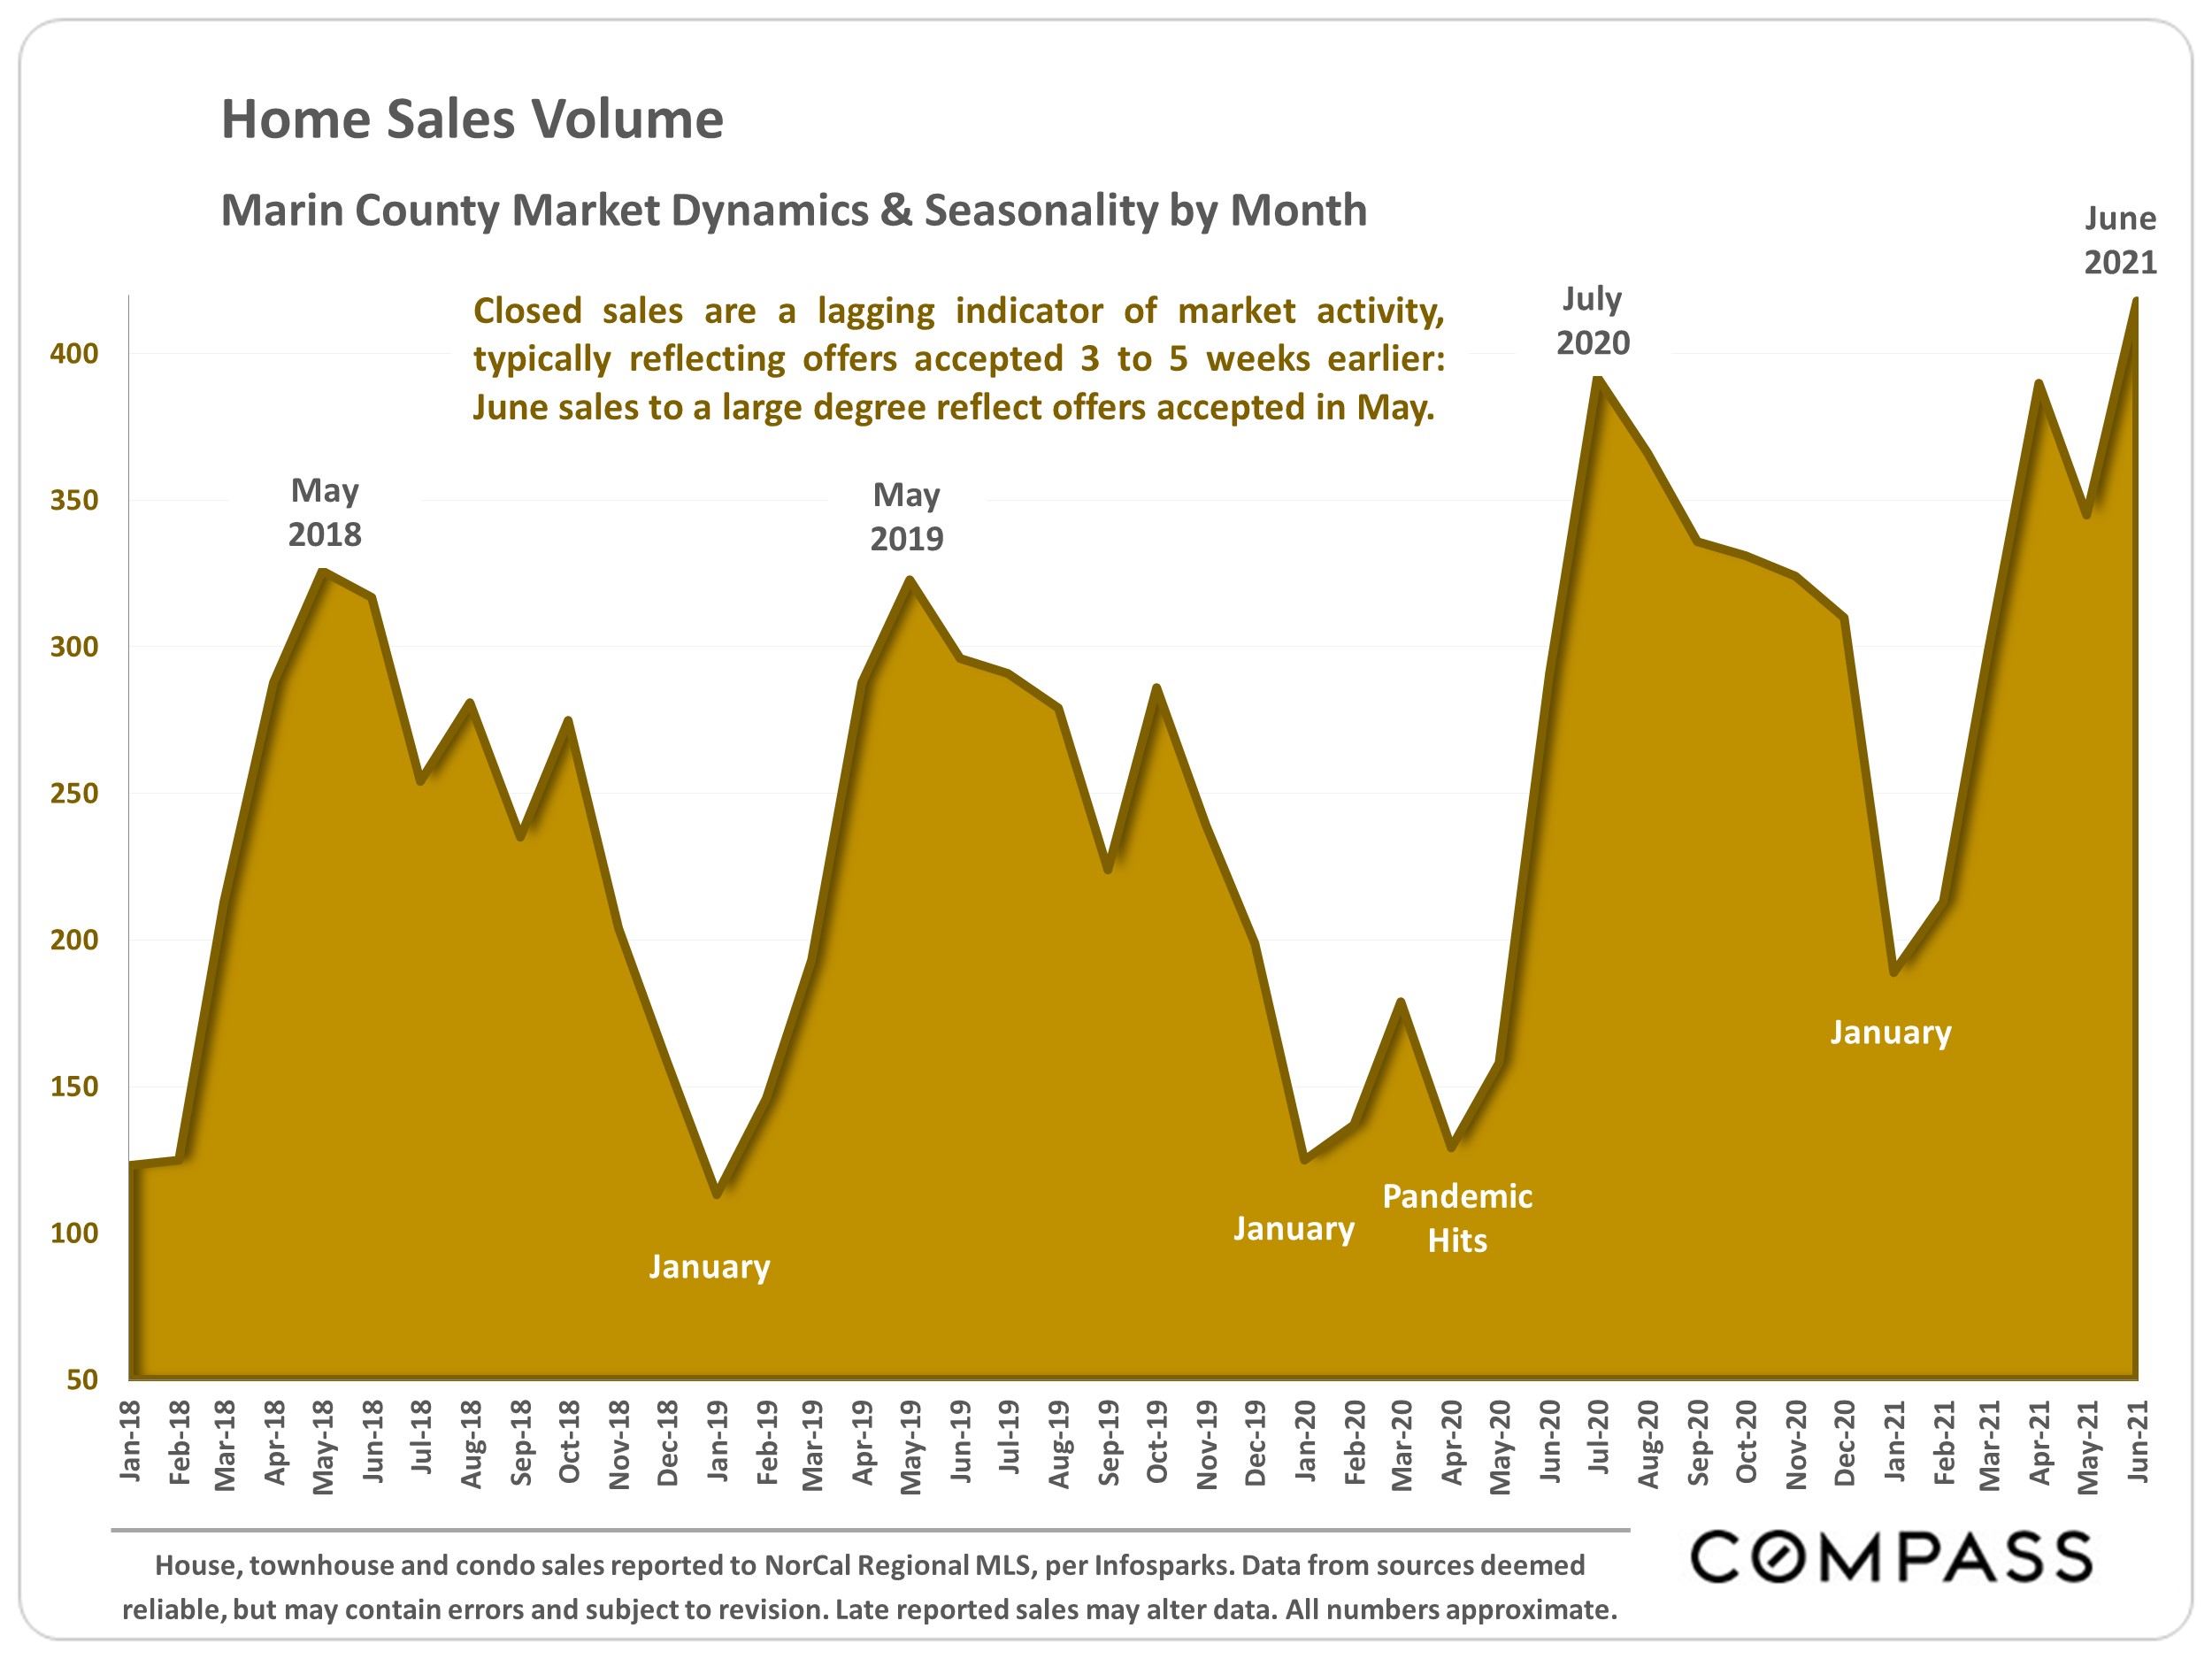
Marin County monthly home sales chart, January 2018–June 2021, with peaks in summer 2020 and June 2021.
Bar chart of Marin County average days on market by quarter, 2017 through Q2 2021.
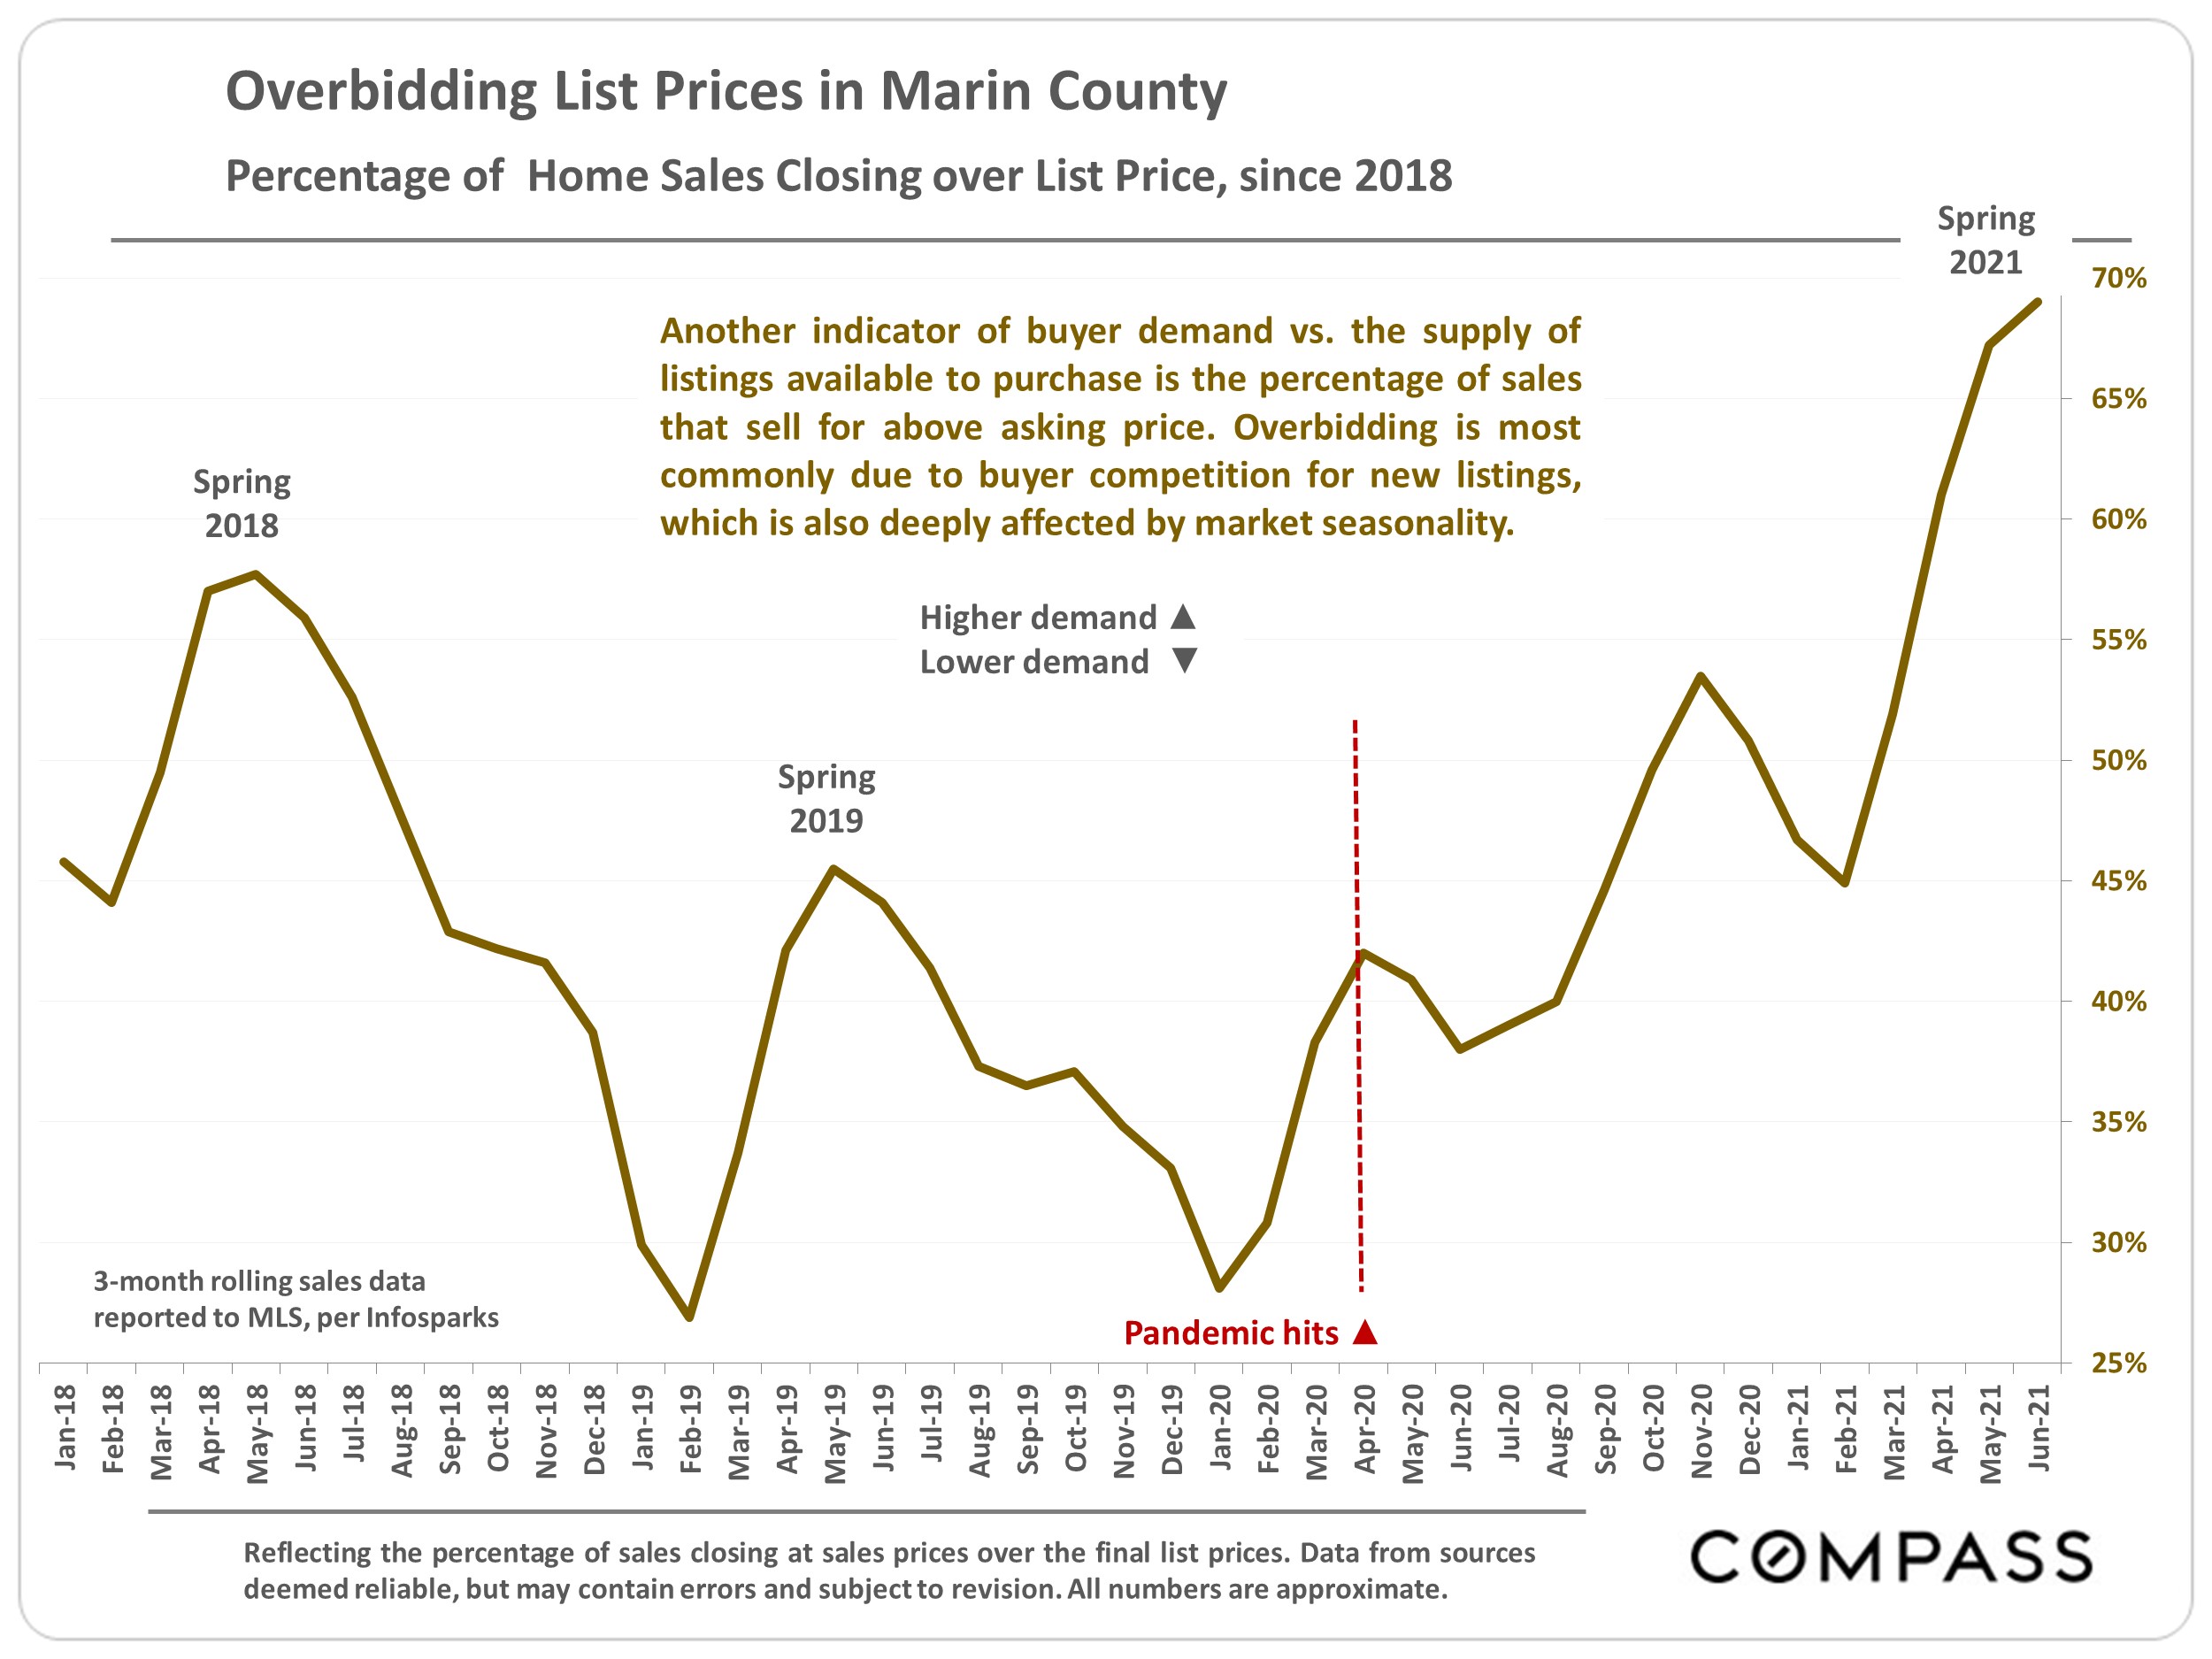
Chart of Marin County home sales over list price, rising to nearly 70% by June 2021.
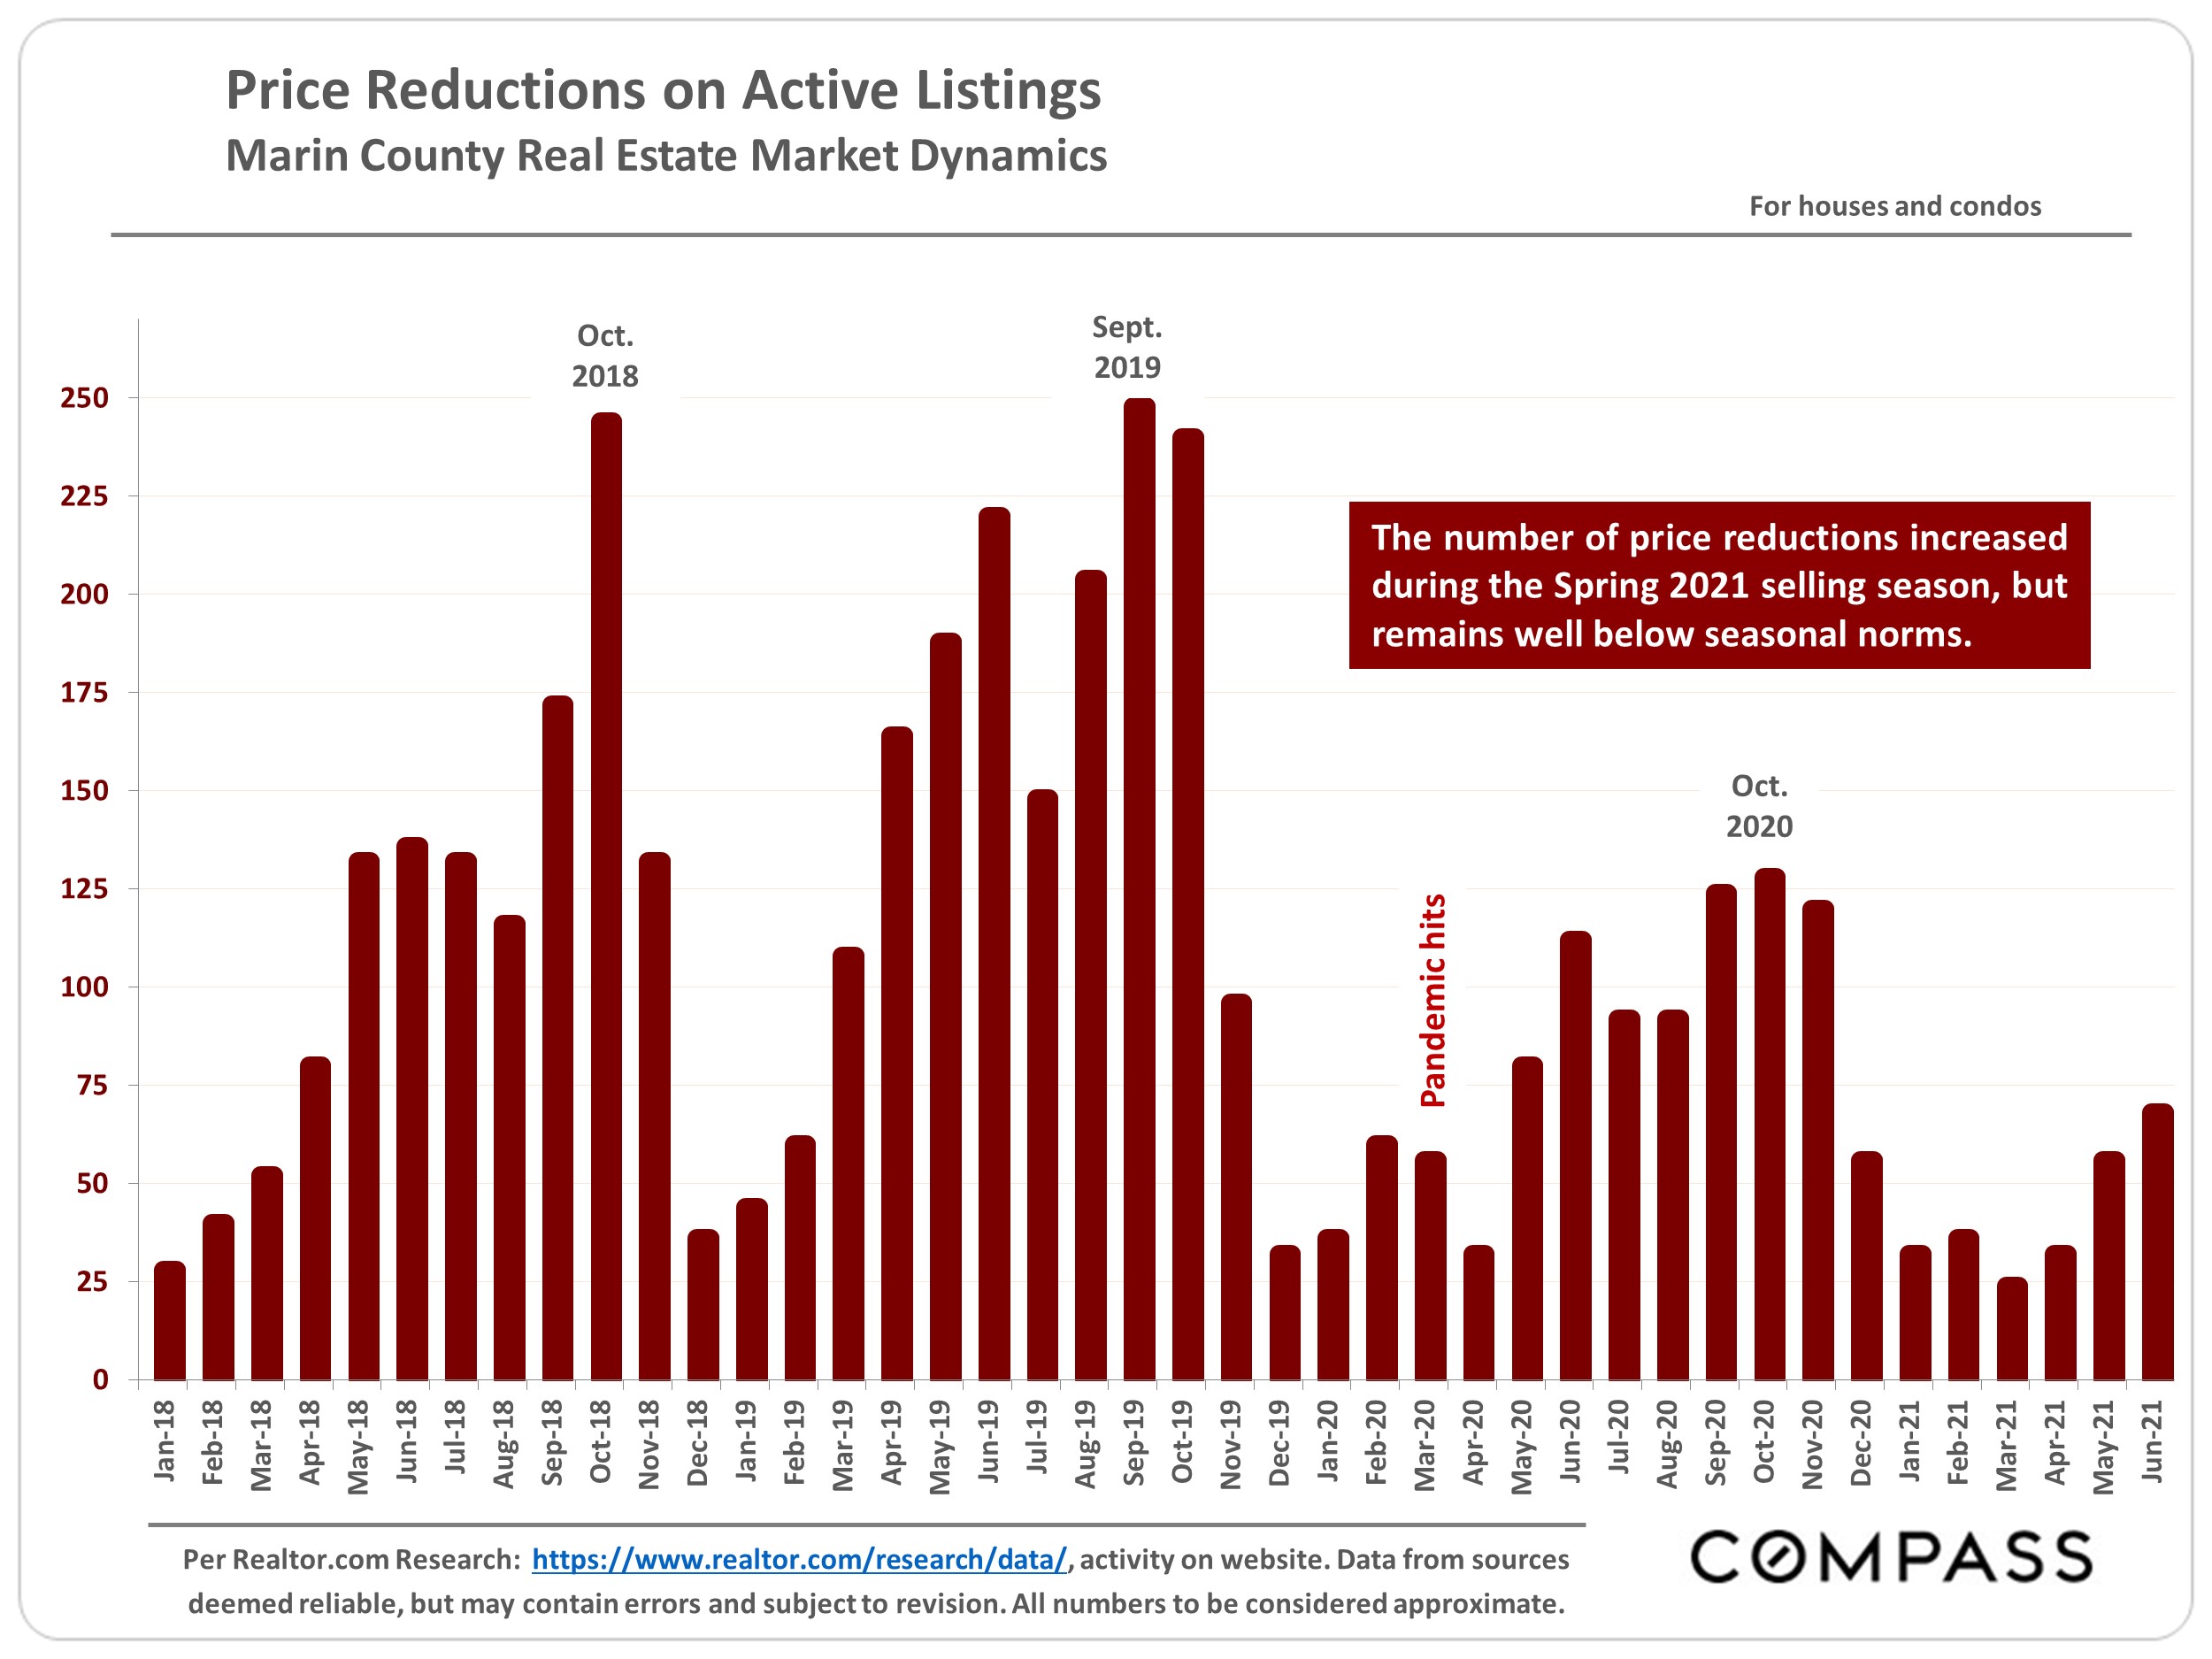
Bar chart of Marin County listing price reductions, showing seasonal peaks in 2018–2019 and lower levels in spring 2021.
Bar chart of Marin County home sales over $3 million by month, January 2018 to June 2021, with spring 2021 peaks.
Marin luxury home sales chart by community and price range, with notes on multimillion-dollar sales and listings.
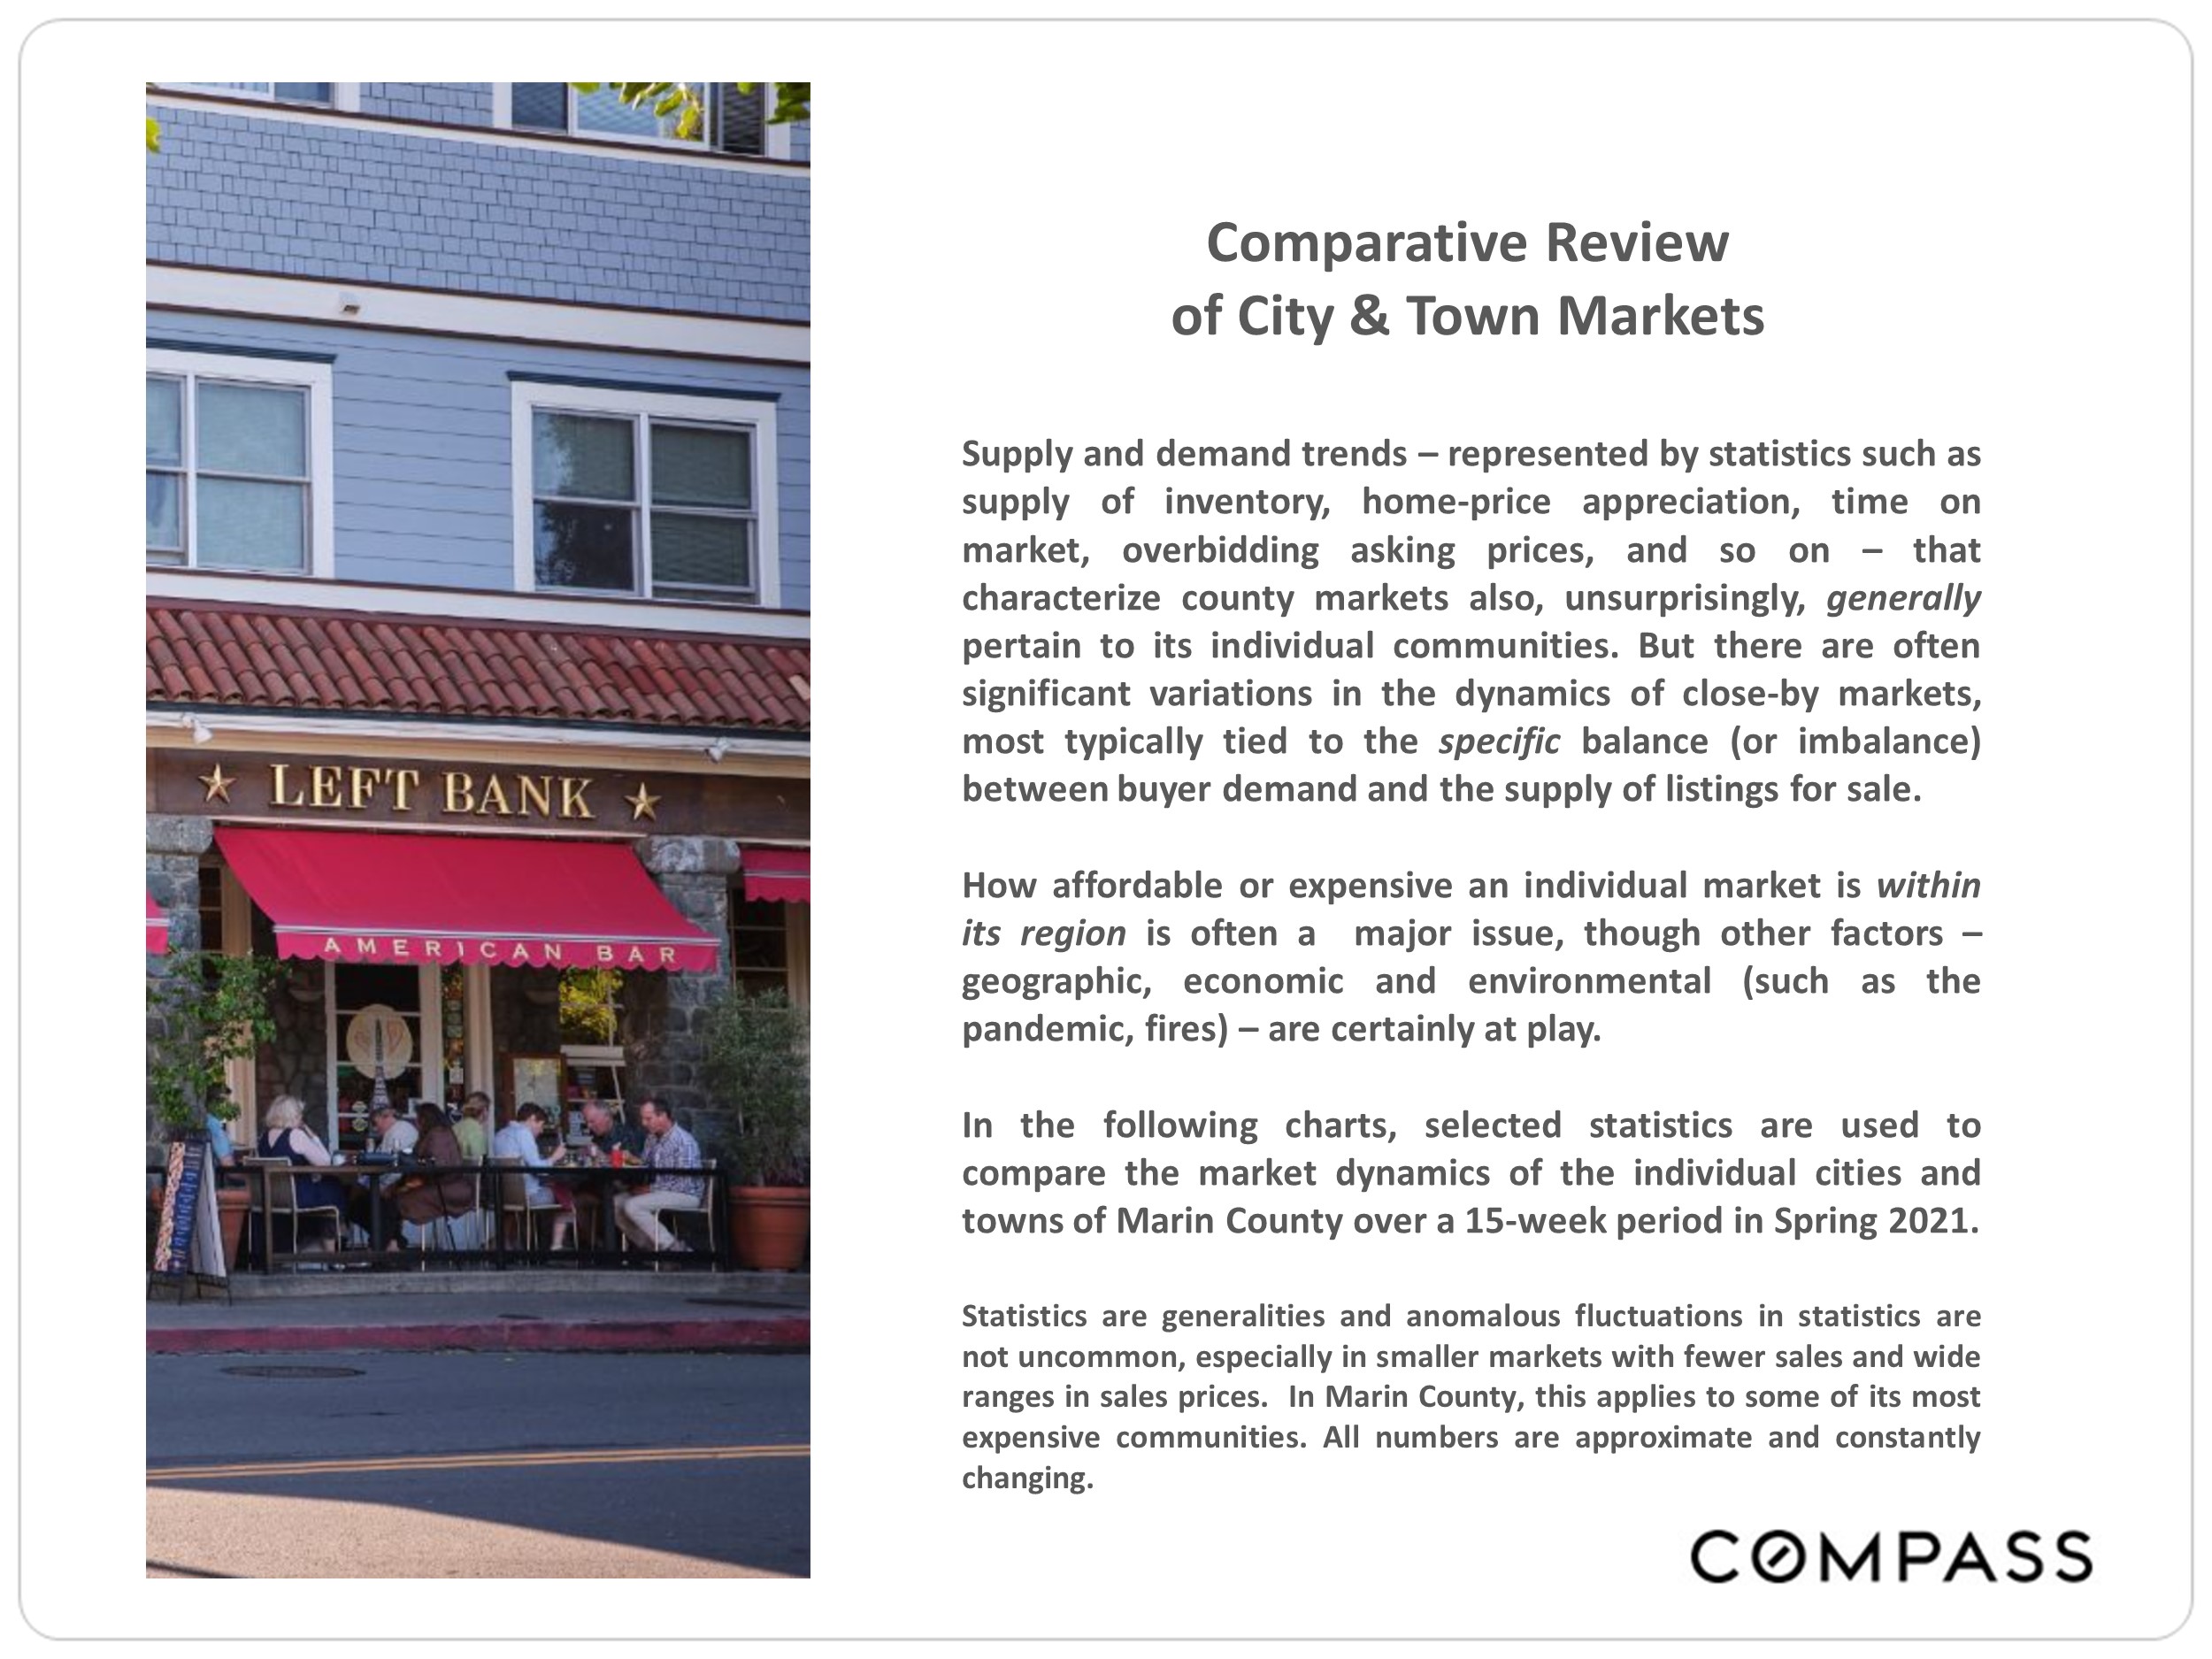
Marin County market report comparing city and town markets, alongside the Left Bank American Bar storefront.
Bar chart of Marin County spring 2021 house sales by community; Novato leads with 220, Stinson Beach has 5.
Chart of spring 2021 median home sale prices across Marin County communities, from $4.15 million in Belvedere to $1.21 million in Novato.
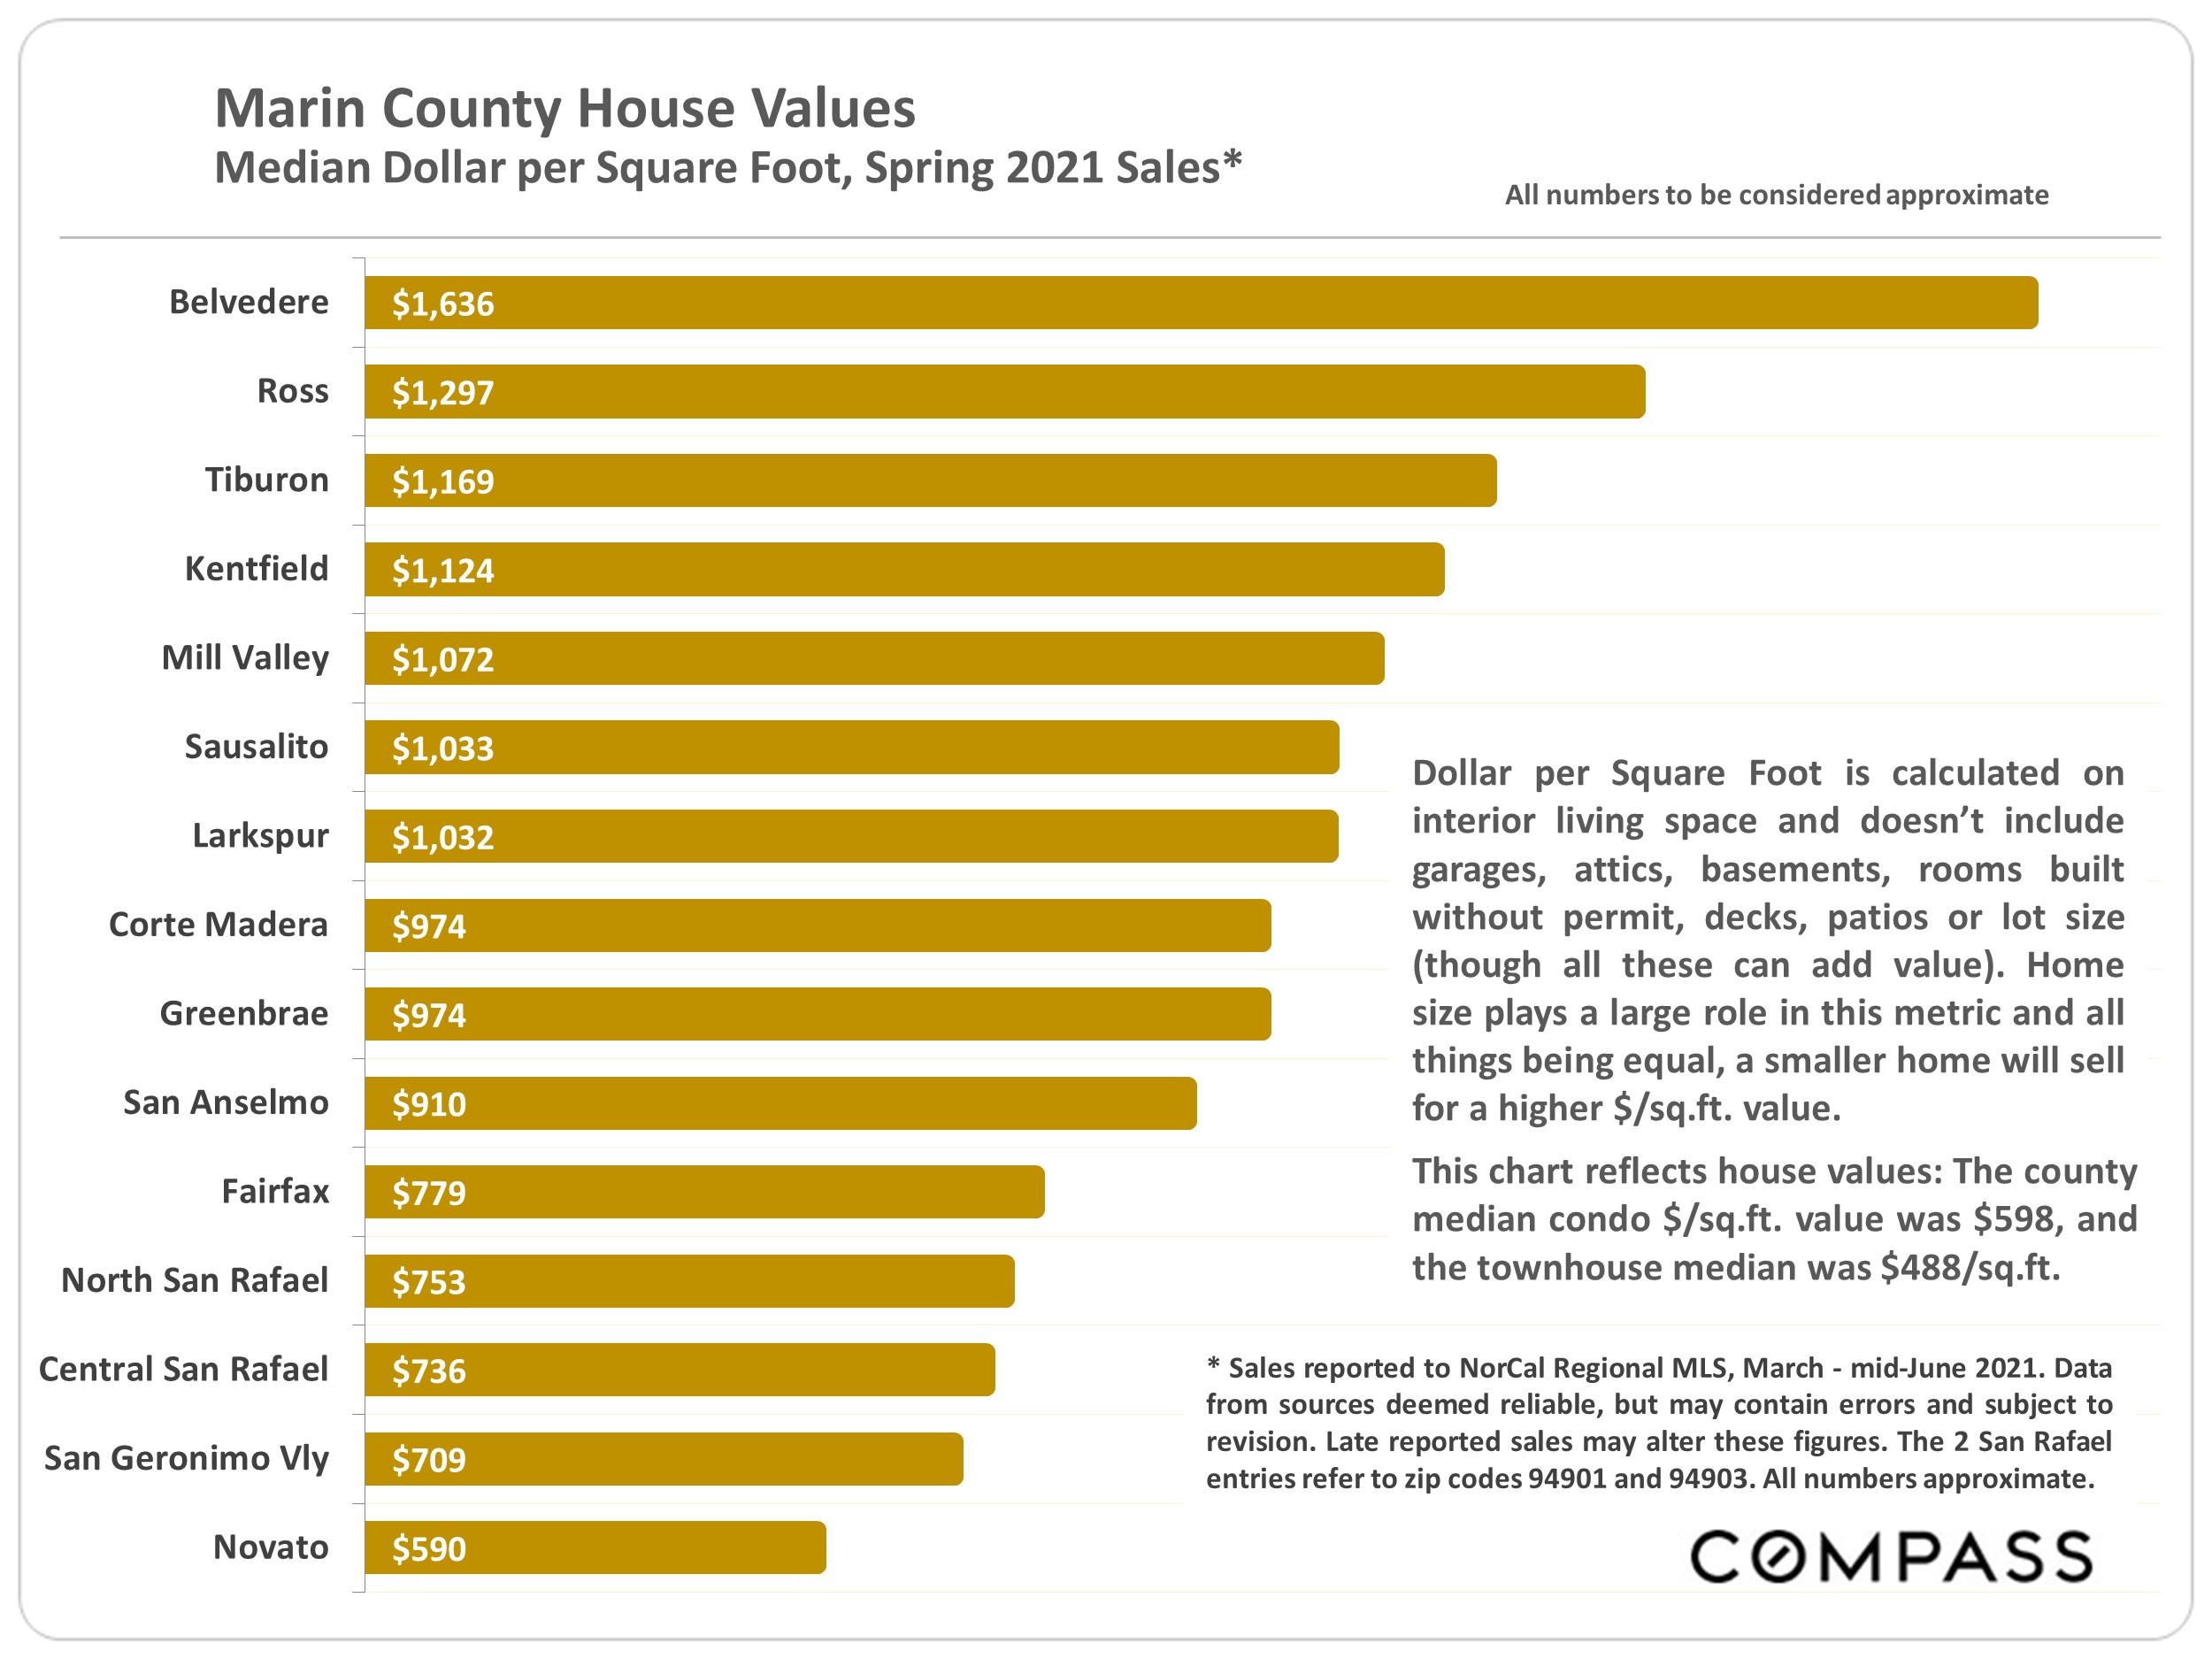
Bar chart of Marin County house values per square foot, with Belvedere highest at $1,636 and Novato lowest at $590.
Bar chart comparing median home square footage across Marin County communities in Spring 2021.
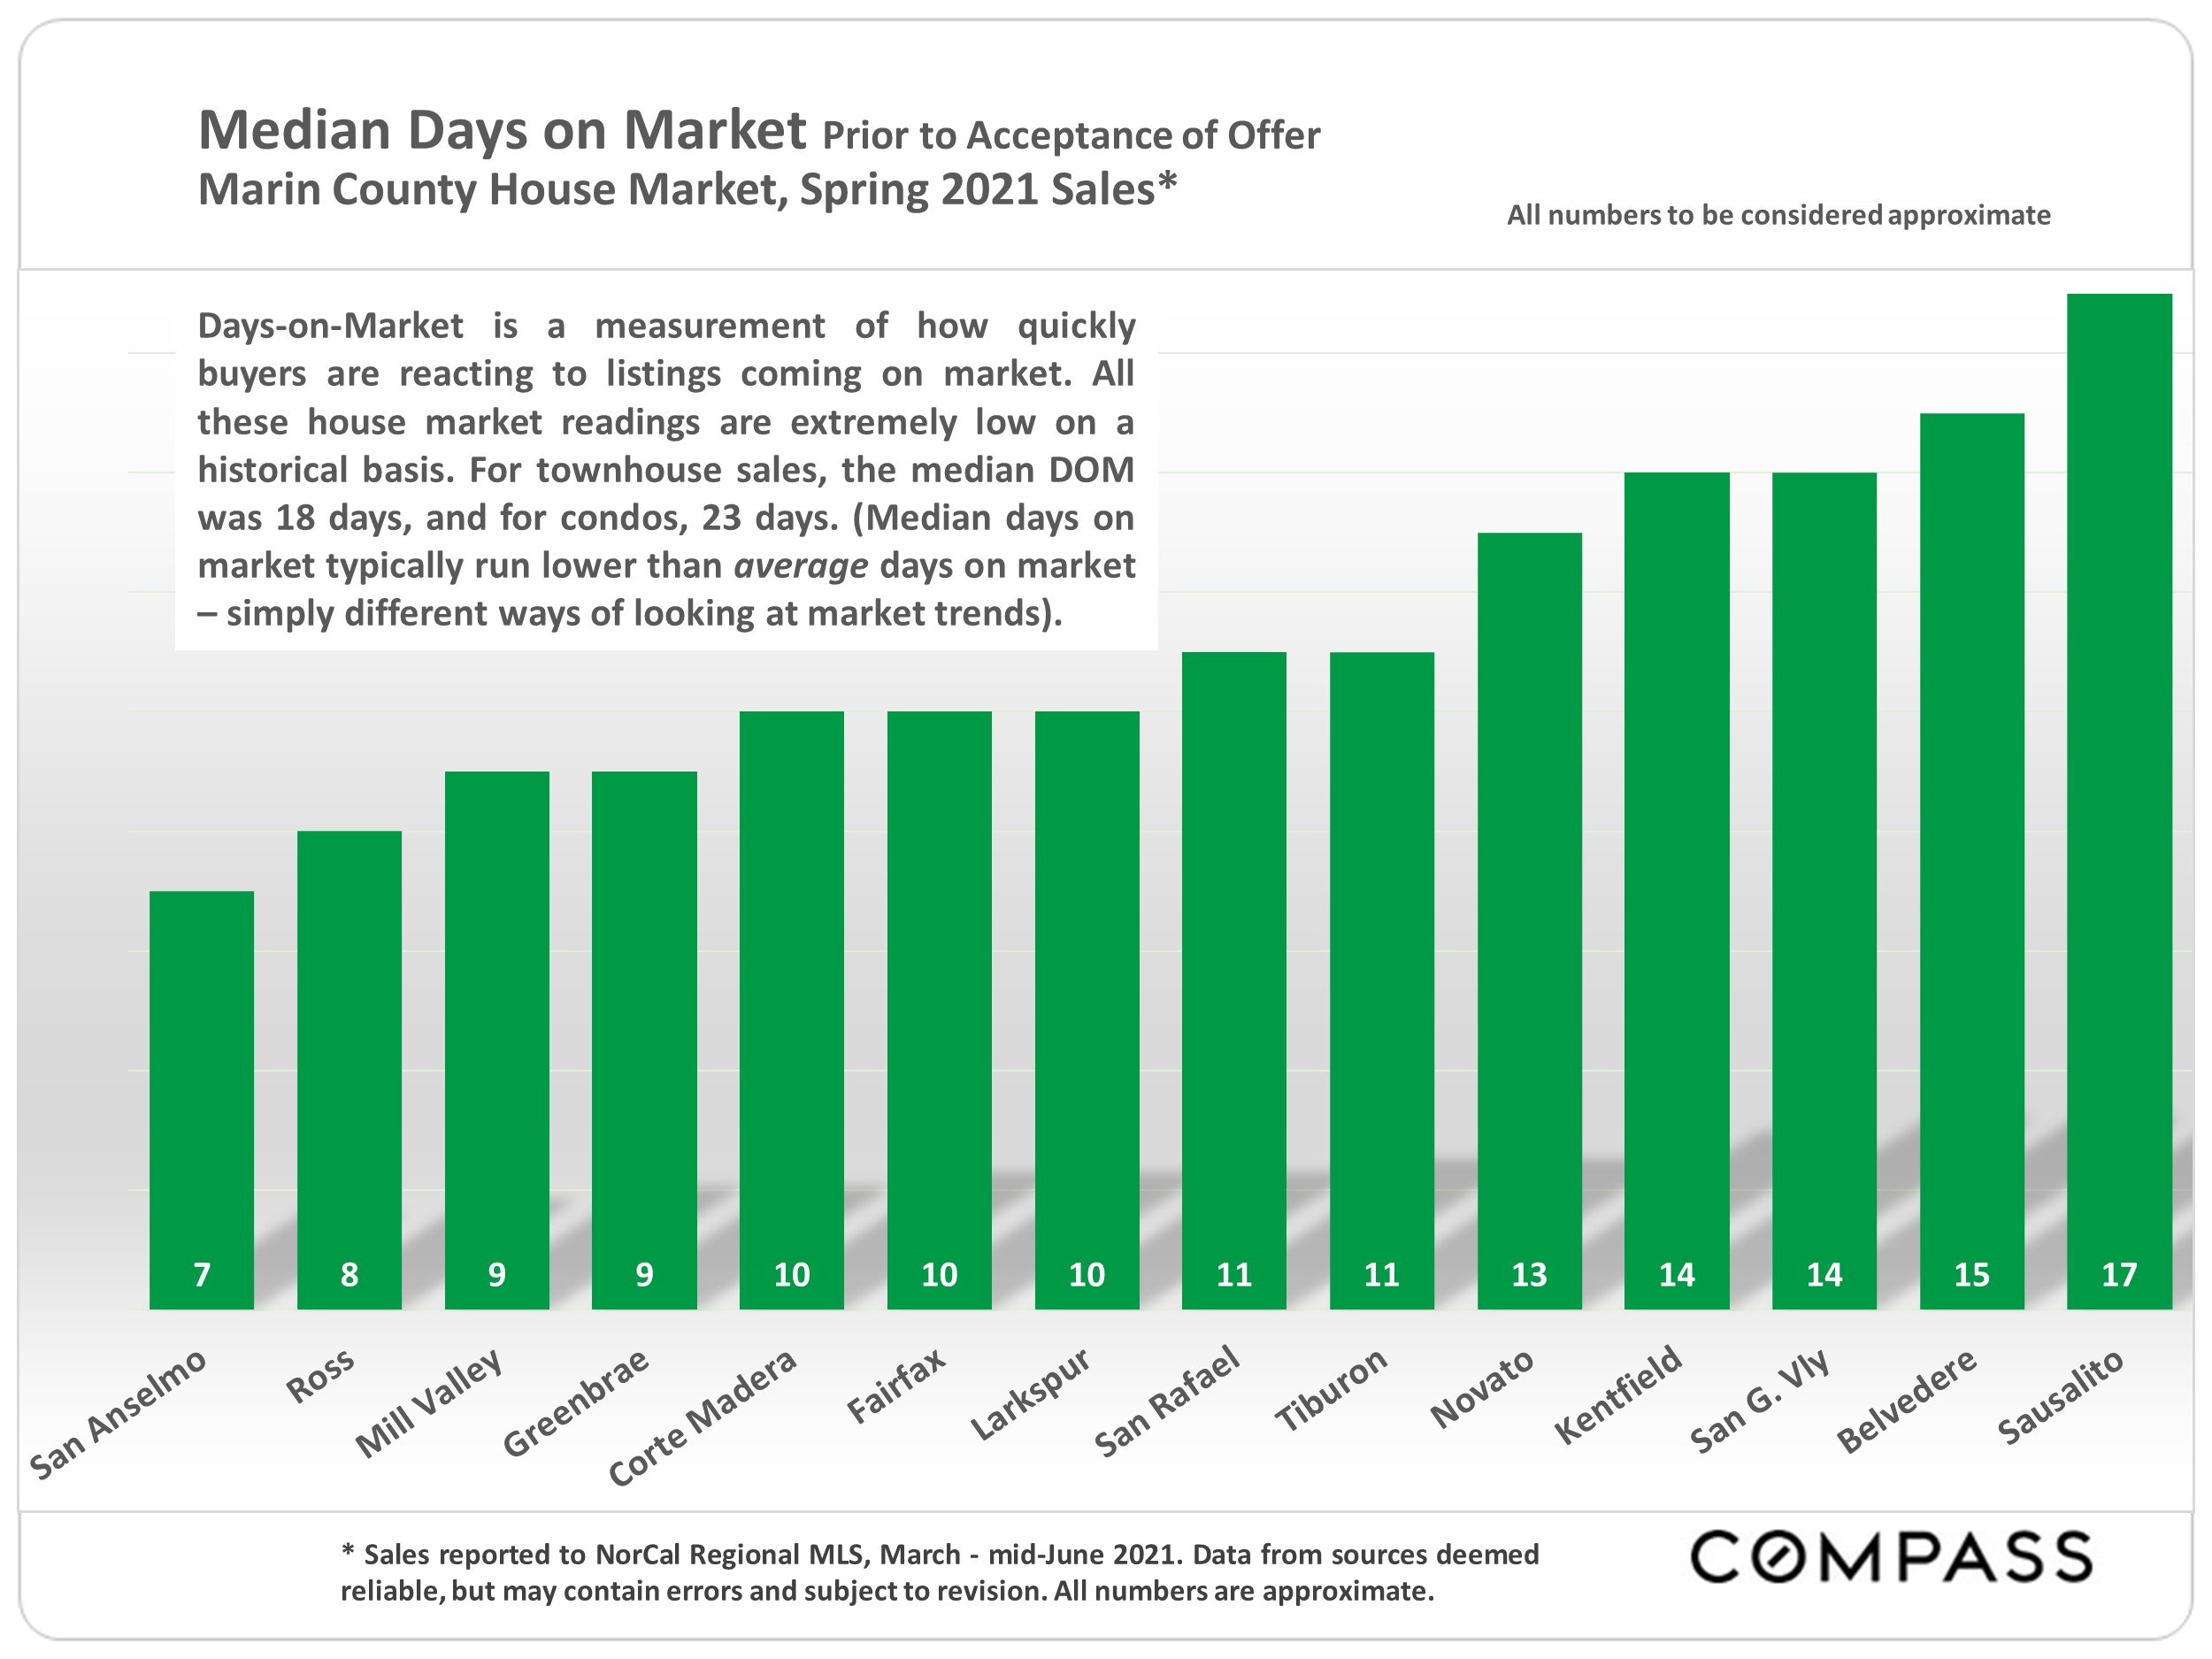
Chart compares median days on market across 14 Marin County communities, from 7 days in San Anselmo to 17 in Sausalito.
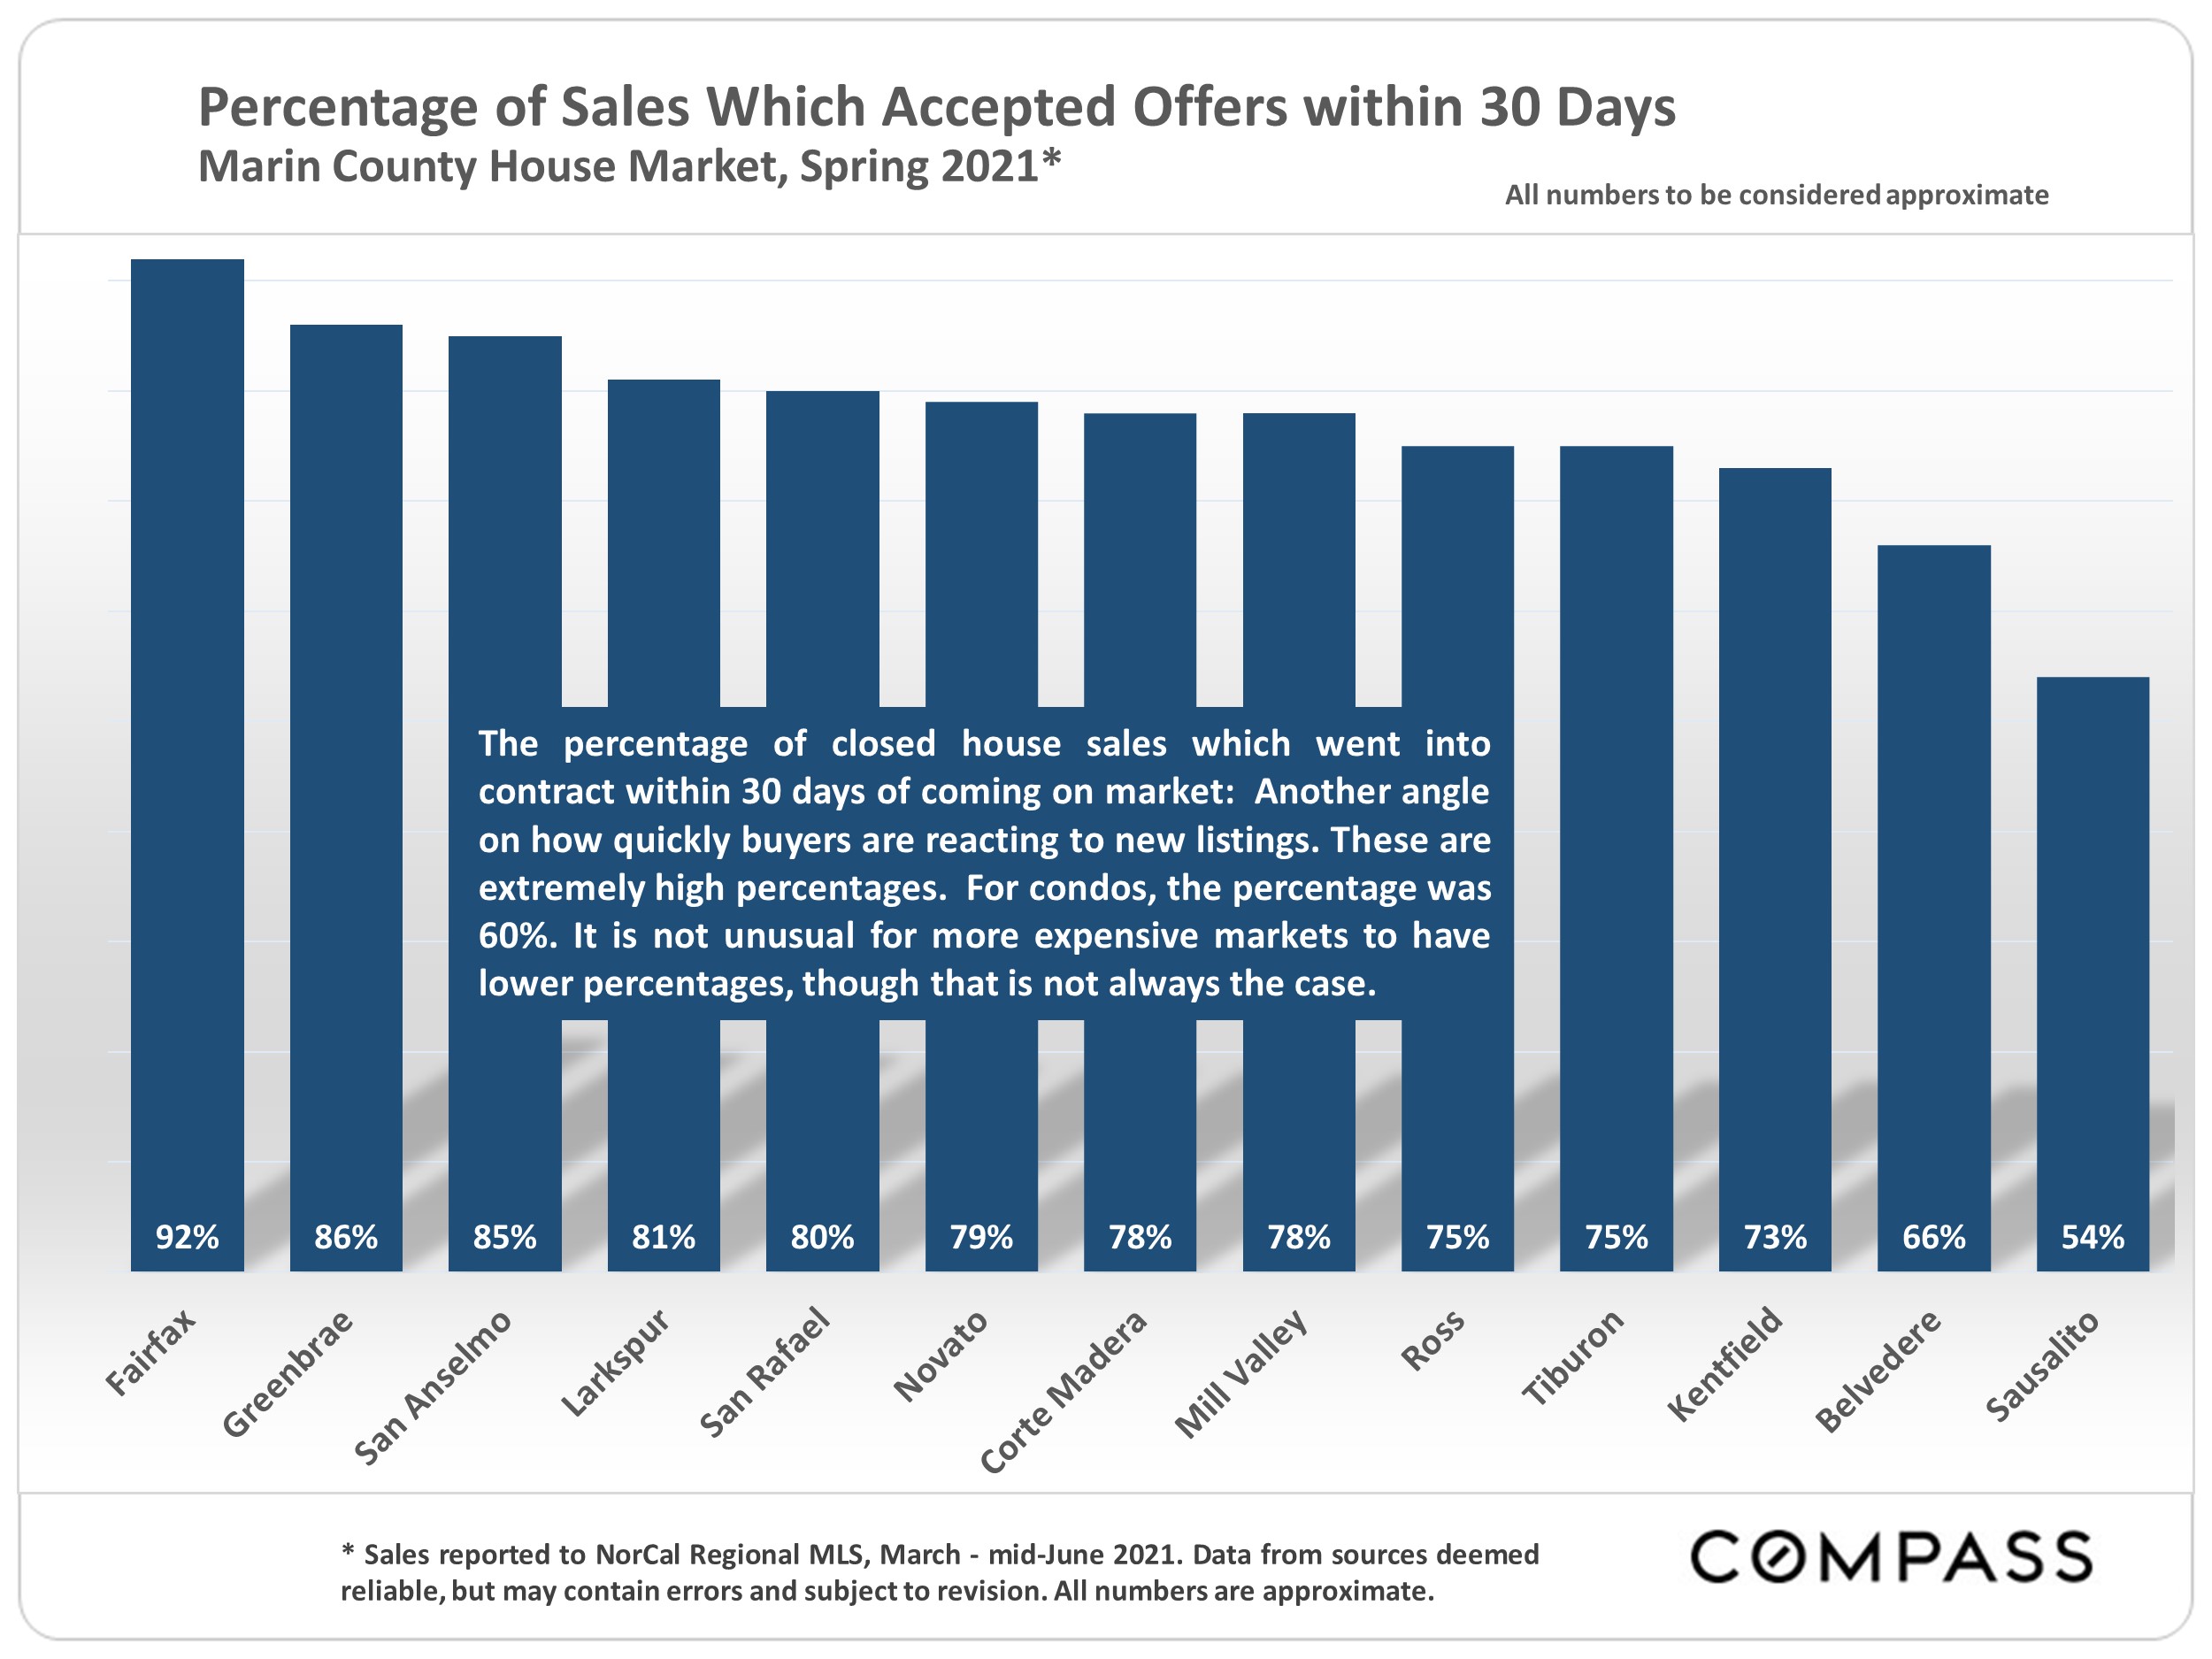
Bar chart of Marin County home sales under contract within 30 days, led by Fairfax at 92% and ending with Sausalito at 54%.
Chart of Marin County spring 2021 home overbids by town, ranging from 13% in San Anselmo to 1% in Belvedere.
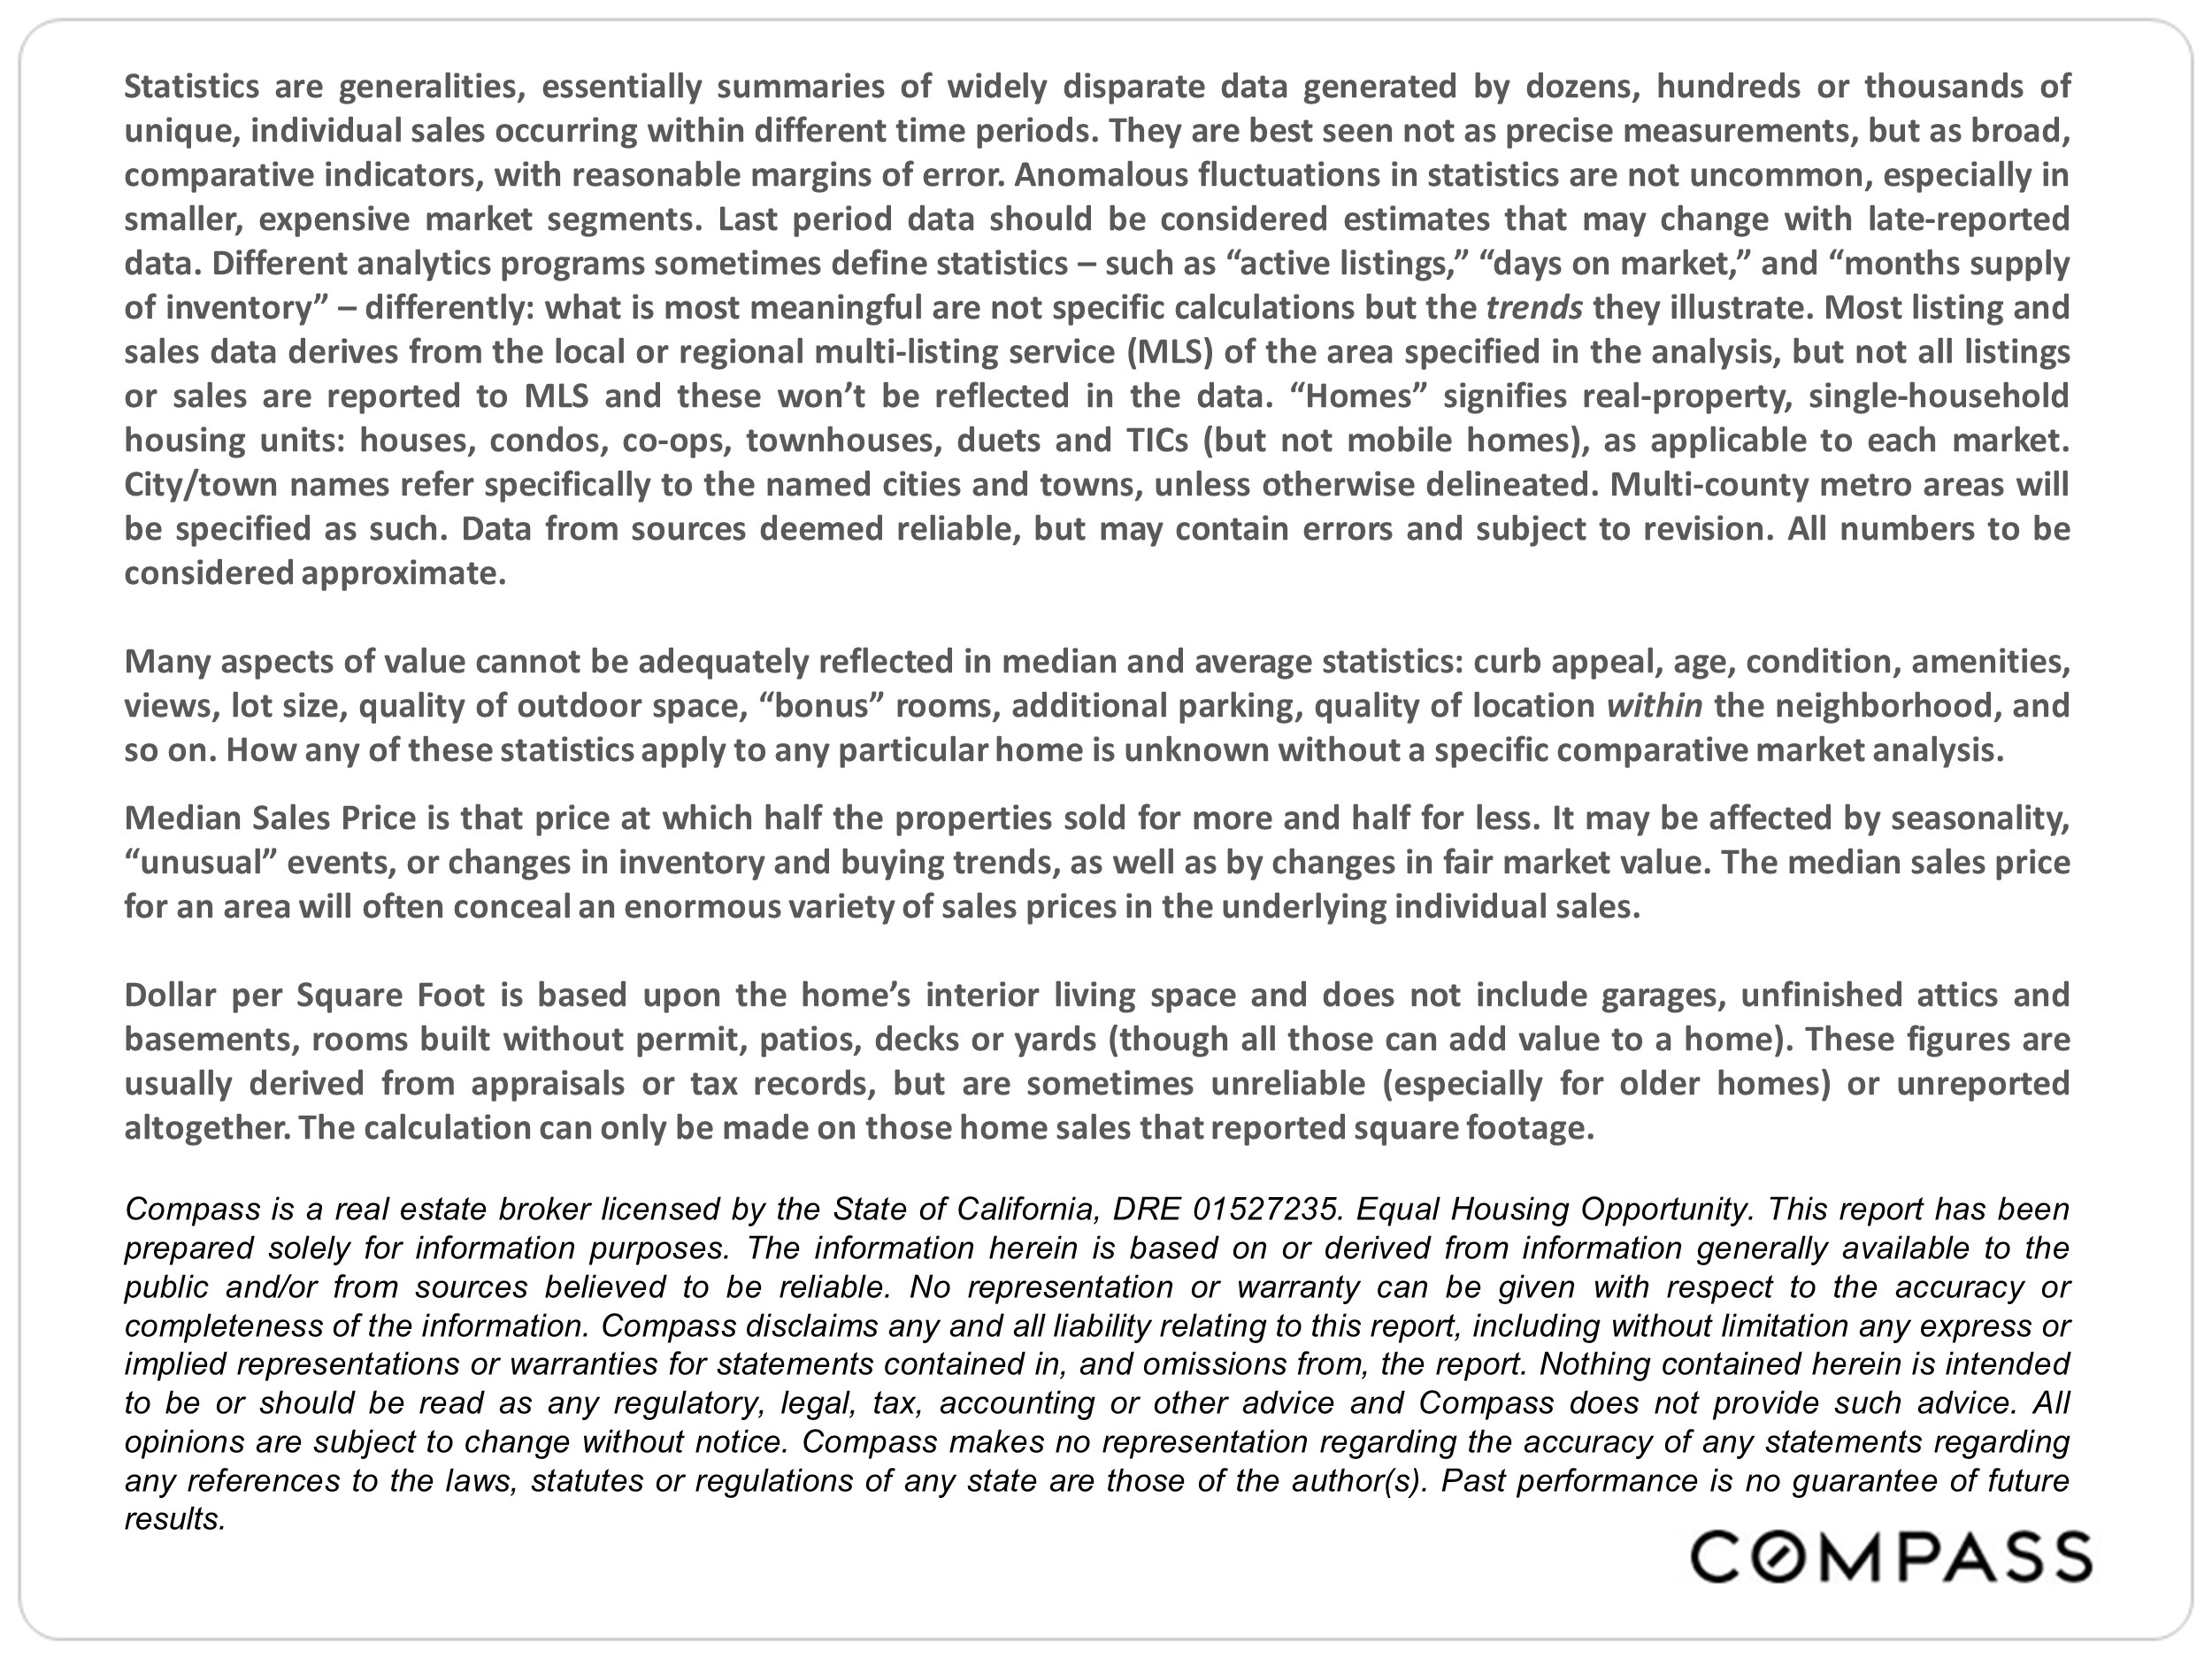
Real estate report disclaimer explaining market statistics and property valuation measures, with Compass branding.

Work With Heather

Heather is a multi-faceted real estate professional with a unique skill set. Remodels design, real estate investing, and the arts with her success in repurposing and modernizing properties she represents, maximizing client’s return on investment.
Let's Connect

Follow Us